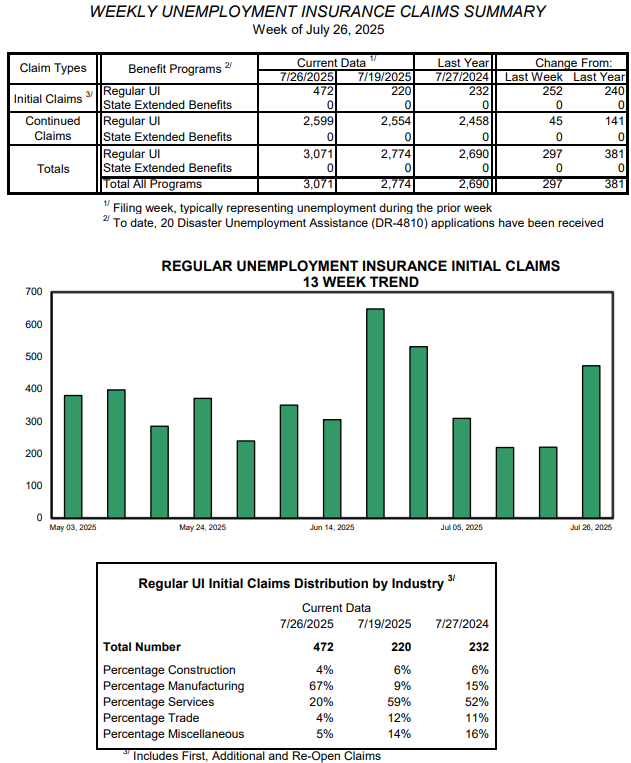
by Timothy McQuiston, Vermont Business Magazine Vermont weekly unemployment claims for the week ending July 26, 2025, spiked and were well above seasonal norms. New claims were 472 last week, up 252 claims from the week before and up 240 from last year at this time. Claims, which tend to be lowest in the summer, were 181 at the end of September 2024.
In Vermont for the weekly report, manufacturing accounted for an unusual 67% of the total, or about 315 claims, up nearly 300 for the week. The Service industry, which typically accounts for the most claims, last week reported 20%, down 39 points from the previous week, or about 35 claims. Construction was 4%, down 2 points or up about 5 claims.
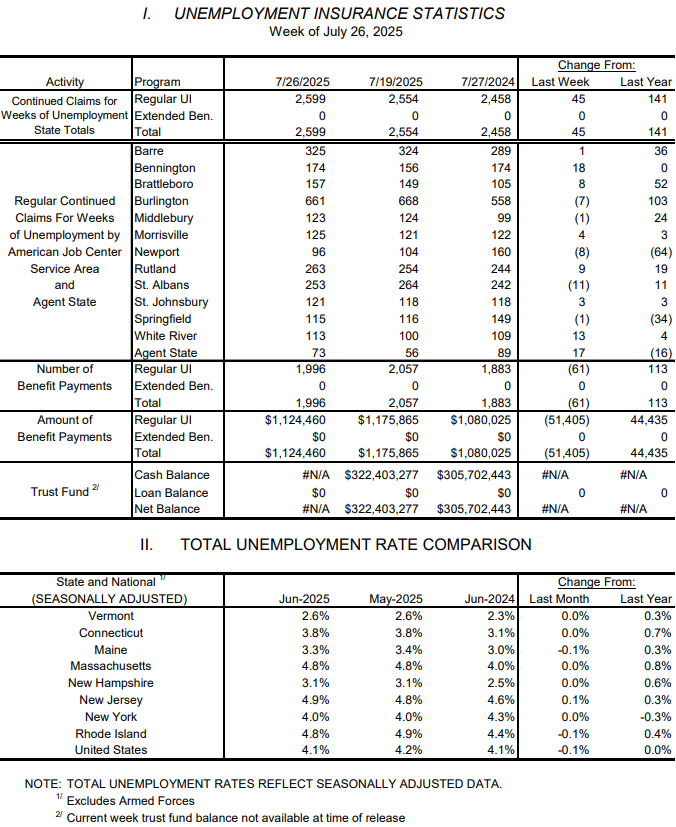
For the week, Vermont total unemployment insurance claims were 3,071 (up 297 for the week and up 381 from this time last year).
The Vermont Unemployment Trust Fund is well capitalized. As of the most recent data, there was $322.4 million in the Trust Fund (as claims are paid out on one side, employers are contributing to the fund on the other). The pre-pandemic Trust Fund balance on March 1, 2020, was $506.2 million.
Across the nation, in the week ending July 26, the advance figure for seasonally adjusted initial claims was 218,000, an increase of 1,000 from the previous week's unrevised level of 217,000. The 4-week moving average was 221,000, a decrease of 3,500 from the previous week's unrevised average of 224,500, according to the US DOL.
Markets
Meanwhile, the stock market fell steeply August 1 after a lackluster July jobs report (see below) despite the passage July 3 of the federal budget adjustment act, which cuts taxes but is expected to also increase the budget deficit. Incoming tariffs along with the jobs report soured the markets after three strong weeks.
The divided Fed on July 30 declined to cut interest rates, infuriating the White House and depressing the stock market. The Fed is in a difficult position. On the one hand the economy appears to be stalling, in large part because of tariff uncertainty, and on the other hand, inflation is pushing up for apparently the same reason. The Fed raised rates starting in 2022 in order to stifle spiking inflation, but at a time when federal stimulus funds and a general economic recovery was also occurring. Now, they must decide on whether to risk more inflation by cutting rates at a time of a weakening economy. Their next meeting is scheduled for September.
The S&P, which most closely tracks the overall economy, had reached historic peaks over the last two weeks on strong earnings and at least the appearance of resiliency against tariff pressure. But the S&P was down over 100 points or nearly 2% midday Friday to about 6,220 after peaking at 6,388.64 on July 25. The Dow, which peaked at over 45,000 in December, was also down Friday about 1.5% Friday to 43,490. While the volatile NASDAQ, which also peaked on July 25, was down over 2% to 20,625 midday Friday.
Year-to-date 2025, the S&P is up 5.8%, after being up 25.7% for all of 2024, up 21.9% in 2023 and up 94.3% over the last 5 years (18.9% per annum). The Dow is up 2.2% YTD and up 66.2% over the last 5 years (13.2% per annum). NASDAQ is up 6.8% YTD and up 96.9% over 5 years (19.4% per annum).
Meanwhile, homes sales fell in June across the US as interest rates stayed around 6.5% and markets softened as homes-for-sale lingered on the market, except in the Northeast, where sales are up 2% despite strong price growth.
US Labor Report: July
Total nonfarm payroll employment changed little in July (+73,000) and has shown little change since April, the U.S. Bureau of Labor Statistics (BLS) reported August 1. The unemployment rate, at 4.2 percent, also changed little in July. Employment continued to trend up in health care and in social assistance. Federal government continued to lose jobs.
This report presents statistics from two monthly surveys. The household survey measures labor force status, including unemployment, by demographic characteristics. The establishment survey measures nonfarm employment, hours, and earnings by industry. For more information about the concepts and statistical methodology used in these two surveys, see the Technical Note.
Household Survey Data
Both the unemployment rate, at 4.2 percent, and the number of unemployed people, at 7.2 million, changed little in July. The unemployment rate has remained in a narrow range of 4.0 percent to 4.2 percent since May 2024. (See table A-1.)
Among the major worker groups, the unemployment rates for adult men (4.0 percent), adult women (3.7 percent), teenagers (15.2 percent), Whites (3.7 percent), Blacks (7.2 percent), Asians (3.9 percent), and Hispanics (5.0 percent) showed little change in July. (See tables A-1, A-2, and A-3.)
Among the unemployed, the number of new entrants increased by 275,000 in July to 985,000. New entrants are unemployed people who are looking for their first job. (See table A-11.)
In July, the number of long-term unemployed (those jobless for 27 weeks or more) increased by 179,000 to 1.8 million. The long-term unemployed accounted for 24.9 percent of all unemployed people. (See table A-12.)
The labor force participation rate, at 62.2 percent, changed little in July but has declined by 0.5 percentage point over the year. The employment-population ratio, at 59.6 percent, also changed little over the month but was down by 0.4 percentage point over the year. (See table A-1.)
The number of people employed part time for economic reasons, at 4.7 million, changed little in July. These individuals would have preferred full-time employment but were working part time because their hours had been reduced or they were unable to find full-time jobs. (See table A-8.)
The number of people not in the labor force who currently want a job changed little in July at 6.2 million but was up by 568,000 over the year. These individuals were not counted as unemployed because they were not actively looking for work during the 4 weeks preceding the survey or were unavailable to take a job. (See table A-1.)
Among those not in the labor force who wanted a job, the number of people marginally attached to the labor force changed little at 1.7 million in July. These individuals wanted and were available for work and had looked for a job sometime in the prior 12 months but had not looked for work in the 4 weeks preceding the survey. The number of discouraged workers decreased by 212,000 in July to 425,000, largely offsetting an increase in the prior month. Discouraged workers are a subset of the marginally attached who believed that no jobs were available for them. (See Summary table A.)
Establishment Survey Data
Total nonfarm payroll employment changed little in July (+73,000) and has shown little change since April. Over the month, employment continued to trend up in health care and in social assistance. Federal government continued to lose jobs. (See table B-1.)
In July, health care added 55,000 jobs, above the average monthly gain of 42,000 over the prior 12 months. Over the month, job gains occurred in ambulatory health care services (+34,000) and hospitals (+16,000).
Social assistance employment continued to trend up in July (+18,000), reflecting continued job growth in individual and family services (+21,000).
Federal government employment continued to decline in July (-12,000) and is down by 84,000 since reaching a peak in January. (Employees on paid leave or receiving ongoing severance pay are counted as employed in the establishment survey.)
Employment showed little change over the month in other major industries, including mining, quarrying, and oil and gas extraction; construction; manufacturing; wholesale trade; retail trade; transportation and warehousing; information; financial activities; professional and business services; leisure and hospitality; and other services.
Average hourly earnings for all employees on private nonfarm payrolls rose by 12 cents, or 0.3 percent, to $36.44 in July. Over the past 12 months, average hourly earnings have increased by 3.9 percent. In July, average hourly earnings of private-sector production and nonsupervisory employees rose by 8 cents, or 0.3 percent, to $31.34. (See tables B-3 and B-8.)
The average workweek for all employees on private nonfarm payrolls edged up by 0.1 hour to 34.3 hours in July. In manufacturing, the average workweek held at 40.1 hours, and overtime edged down to 2.8 hours. The average workweek for production and nonsupervisory employees on private nonfarm payrolls edged up by 0.1 hour to 33.7 hours in July. (See tables B-2 and B-7.)
Revisions for May and June were larger than normal. The change in total nonfarm payroll employment for May was revised down by 125,000, from +144,000 to +19,000, and the change for June was revised down by 133,000, from +147,000 to +14,000. With these revisions, employment in May and June combined is 258,000 lower than previously reported. (Monthly revisions result from additional reports received from businesses and government agencies since the last published estimates and from the recalculation of seasonal factors.)
Vermont’s unemployment rate unchanged at 2.6 percent in June | Vermont Business Magazine
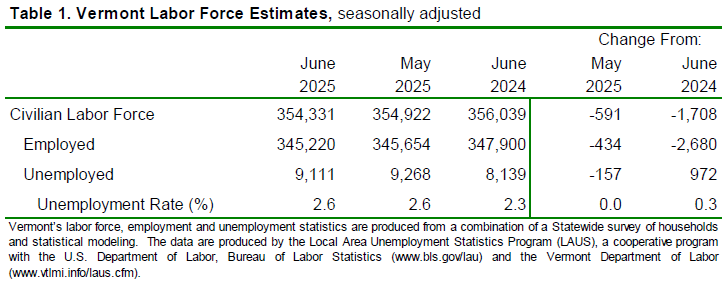
by Timothy McQuiston, Vermont Business Magazine Today, the Vermont Department of Labor reported that the seasonally adjusted statewide unemployment rate for June was 2.6%. This reflects no change from the prior month’s revised estimate. The Labor Force and Employed were both down, offset by a decrease in Unemployed from May. The civilian labor force participation rate was 64.9% in June, a decrease of one-tenth of one percentage point from the prior month’s revised estimate. Vermont has the third lowest jobless rate, behind South (1.8%) and North Dakota (2.5%). Nevada has the highest rate again, tied with California, at 5.4%. Washington DC has the overall highest rate at 5.9%. The national rate is 4.1%.
Compared to June 2024, Vermont was tied for the second lowest rate in the nation (since revised up to 2.3%) with North Dakota at 2.1%. South Dakota had the lowest rate (2.0%), while Nevada and California had the highest rates (5.2%). Washington DC was 5.4%. The comparable US rate in June 2024 was 4.1 percent.
The United States jobless rate in July was 4.2 percent, an increase of one-tenth of one percentage point from the revised June estimate. The seasonally adjusted Vermont data for June show the Vermont civilian labor force decreased by 591 from the prior month’s revised estimate (see Table 1). The number of employed persons decreased by 434 and the number of unemployed persons decreased by 157. No changes were statistically significant in the seasonally-adjusted series.
The June unemployment rates for Vermont’s 14 counties ranged from 2.2 percent in Addison and Windsor Counties to 2.9 percent in Orleans County (note: county unemployment rates are not seasonally-adjusted – see Table 2). For comparison, the June unadjusted unemployment rate for Vermont was 2.4 percent, an increase of two-tenths of one percentage point from the revised unadjusted May level and an increase of one-tenth of one percentage point from a year ago.
To support vital journalism, access our archives and get unique features like our award-winning profiles, Book of Lists & Business-to-Business Directory, subscribe HERE!
