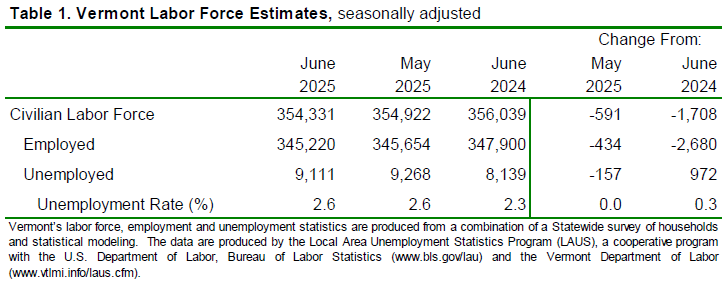
by Timothy McQuiston, Vermont Business Magazine Today, the Vermont Department of Labor reported that the seasonally adjusted statewide unemployment rate for June was 2.6%. This reflects no change from the prior month’s revised estimate. The Labor Force and Employed were both down, offset by a decrease in Unemployed from May. The civilian labor force participation rate was 64.9% in June, a decrease of one-tenth of one percentage point from the prior month’s revised estimate. Vermont has the third lowest jobless rate, behind South (1.8%) and North Dakota (2.5%). Nevada has the highest rate again, tied with California, at 5.4%. Washington DC has the overall highest rate at 5.9%. The national rate is 4.1%.
Compared to June 2024, Vermont was tied for the second lowest rate in the nation (since revised up to 2.3%) with North Dakota at 2.1%. South Dakota had the lowest rate (2.0%), while Nevada and California had the highest rates (5.2%). Washington DC was 5.4%. The comparable US rate in June 2024 was 4.1 percent.
"That's why our work at the Department of Labor is more critical than ever. We're here to support job seekers at every stage of life, from helping young people gain experience through summer jobs to partnering with community organizations who specialize in opportunities for older workers.
"Whether you're just starting or planning your next career move, your local Department of Labor office is here to help. Learn more at labor.vermont.gov."
The United States jobless rate in June was 4.1 percent, a decrease of one-tenth of one percentage point from the revised May estimate. The seasonally adjusted Vermont data for June show the Vermont civilian labor force decreased by 591 from the prior month’s revised estimate (see Table 1). The number of employed persons decreased by 434 and the number of unemployed persons decreased by 157. No changes were statistically significant in the seasonally-adjusted series.
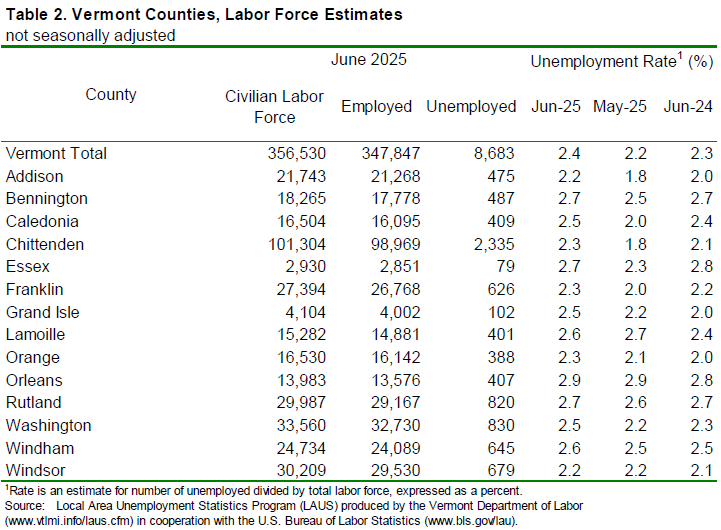
The June unemployment rates for Vermont’s 14 counties ranged from 2.2 percent in Addison and Windsor Counties to 2.9 percent in Orleans County (note: county unemployment rates are not seasonally-adjusted – see Table 2). For comparison, the June unadjusted unemployment rate for Vermont was 2.4 percent, an increase of two-tenths of one percentage point from the revised unadjusted May level and an increase of one-tenth of one percentage point from a year ago.
*** BLS note on LAUS geography and data changes in 2025: https://www.bls.gov/lau/geography-and-data-changes-in-2025.htm ***
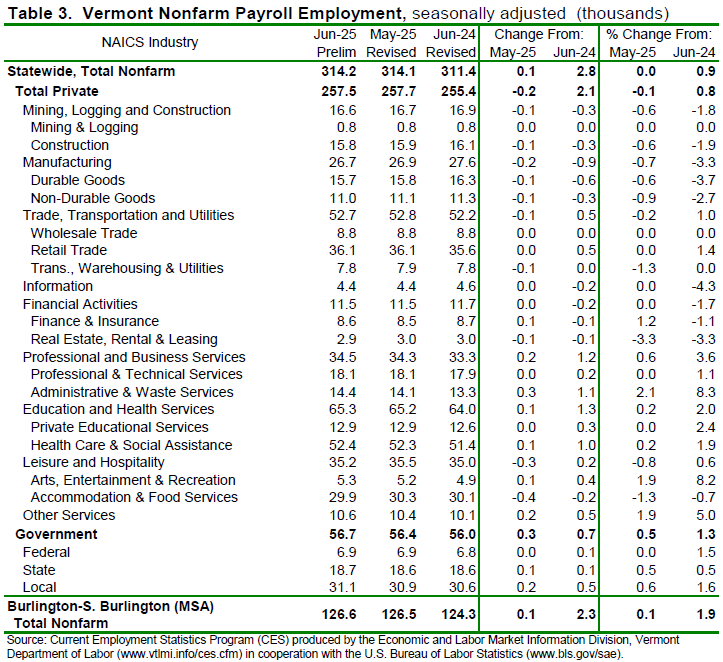
Seasonally Adjusted (Table 3)
The seasonally adjusted data for June reported an increase of 100 jobs from the revised May data. There was a decrease of 500 jobs between the preliminary and the revised May estimates due to the inclusion of more data. The seasonally adjusted over-the-month changes in June varied at the industry level. The industries with a notable increase were Administrative & Waste Services (+300 jobs or +2.1%) and Other Services (+200 jobs or +1.9%). The industry with a notable decrease was Accommodation & Food Services (-400 jobs or -1.3%).
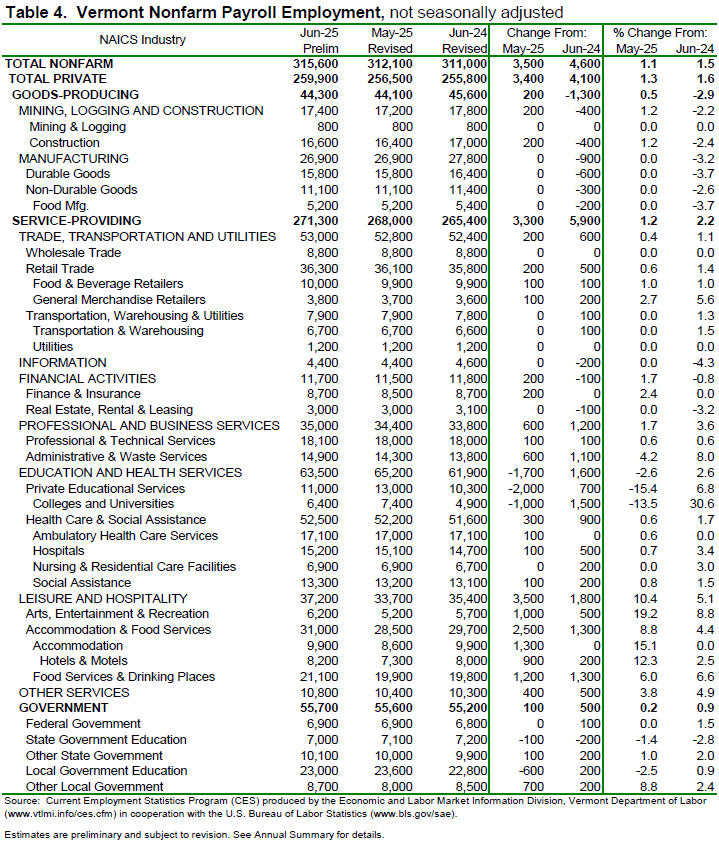
Not-Seasonally-Adjusted (Table 4)
The preliminary ‘not-seasonally-adjusted’ jobs estimates for June showed an increase of 3,500 jobs when compared to the revised May numbers. As with the seasonally adjusted data, this over-the-month change is from the revised May numbers which experienced a decrease of 500 jobs from the preliminary estimates. The broader economic picture can be seen by focusing on the over-the-year changes in this data series.
As detailed in the preliminary not-seasonally-adjusted June data, Total Private industries increased by 4,100 jobs (+1.6%) over the year and Government (including public education) employment increased by 500 jobs (+0.9%) in the past year.
The Unemployment and Jobs Report for July is scheduled to be released on Tuesday, August 19, 2025, at 10:00 a.m.
| State | June 2025(p) rate |
Rank |
|---|---|---|
|
South Dakota |
1.8 | 1 |
|
North Dakota |
2.5 | 2 |
|
Vermont |
2.6 | 3 |
|
Hawaii |
2.8 | 4 |
|
Montana |
2.8 | 4 |
|
Nebraska |
3.0 | 6 |
|
New Hampshire |
3.1 | 7 |
|
Oklahoma |
3.1 | 7 |
|
Alabama |
3.2 | 9 |
|
Utah |
3.2 | 9 |
|
Wisconsin |
3.2 | 9 |
|
Maine |
3.3 | 12 |
|
Maryland |
3.3 | 12 |
|
Minnesota |
3.3 | 12 |
|
Wyoming |
3.3 | 12 |
|
Georgia |
3.5 | 16 |
|
Tennessee |
3.5 | 16 |
|
Virginia |
3.5 | 16 |
|
Idaho |
3.6 | 19 |
|
Indiana |
3.6 | 19 |
|
Arkansas |
3.7 | 21 |
|
Florida |
3.7 | 21 |
|
Iowa |
3.7 | 21 |
|
North Carolina |
3.7 | 21 |
|
West Virginia |
3.7 | 21 |
|
Connecticut |
3.8 | 26 |
|
Kansas |
3.8 | 26 |
|
Delaware |
4.0 | 28 |
|
Mississippi |
4.0 | 28 |
|
Missouri |
4.0 | 28 |
|
New York |
4.0 | 28 |
|
Pennsylvania |
4.0 | 28 |
|
Texas |
4.0 | 28 |
|
Arizona |
4.1 | 34 |
|
South Carolina |
4.1 | 34 |
|
New Mexico |
4.2 | 36 |
|
Louisiana |
4.5 | 37 |
|
Washington |
4.5 | 37 |
|
Illinois |
4.6 | 39 |
|
Alaska |
4.7 | 40 |
|
Colorado |
4.7 | 40 |
|
Massachusetts |
4.8 | 42 |
|
Rhode Island |
4.8 | 42 |
|
Kentucky |
4.9 | 44 |
|
New Jersey |
4.9 | 44 |
|
Ohio |
4.9 | 44 |
|
Oregon |
4.9 | 44 |
|
Michigan |
5.3 | 48 |
|
California |
5.4 | 49 |
|
Nevada |
5.4 | 49 |
|
District of Columbia |
5.9 | 51 |
|
Footnotes |
||
|
Note: Rates shown are a percentage of the labor force. Data refer to place of residence. Estimates for the current month are subject to revision the following month. |
||
To support vital journalism, access our archives and get unique features like our award-winning profiles, Book of Lists & Business-to-Business Directory, subscribe HERE!
