by Tim Ashe, Deputy State Auditor
The Vermont Employment Growth Incentive (VEGI) program is intended to provide an incentive for economic activity that would not occur but for the incentive and which is above and beyond what would normally occur (e.g., background growth). Per statute, accounting for background growth and excluding it from the incentive calculation is required. Currently, the Vermont Economic Progress Council’s incentive award calculation utilizes industry average growth rates to measure and account for background growth.
The appropriate discount factor to represent background growth has long been debated. We decided to conduct an audit because of this debate, and concerns that the State could be providing an incentive for economic activity that would have occurred anyway if the industry average growth rates tend to be significantly lower than a company’s actual average growth rate.
Our work with an economist found significant differences between the industry average growth rates used to represent background growth and companies’ average growth rates for several of the 21 incentives reviewed. The data we present in this report can be used to inform discussion about the best growth rate to use to avoid providing an incentive for economic activity that would normally occur.
I would like to thank VEPC and the Vermont Department of Taxes staff for their cooperation and professionalism throughout the audit.
This report is available on the state auditor’s website, http://auditor.vermont.gov/.
VEGI
The purpose of the Vermont Employment Growth Incentive (VEGI) program is to provide an incentive for economic activity (i.e., job and payroll creation and capital investment) that would not occur except for the incentive (the “but for”), is above and beyond what would normally occur, and which is adjusted (discounted) to ensure that public funds are not used to pay for activity that might have occurred anyway. Per statute, the projected value of background growth in payroll must be excluded from the incentive approved by the Vermont Economic Progress Council (VEPC), the agency responsible for evaluating applications and determining incentive awards.
In 2016, the legislatively established VEGI Technical Working Group (2016 TWG) indicated whether a public subsidy is necessary or critical “cannot be verified” but noted VEGI uses several mechanisms to discount for the growth that might have occurred without public incentives. These mechanisms are designed to maximize the State’s fiscal gain and to help limit public exposure to fiscal loss from the program. One such mechanism is to account for background growth and exclude it from the incentive calculation.
Currently, VEPC utilizes an applicant’s industry average growth rate to represent background growth when calculating incentive awards. These growth rates are based on Vermont Department of Labor long-term wage and salary growth data from 1990 to 2007. However, the appropriate discount factor to represent background growth has long been debated.
According to VEPC, in 1998 several different methodologies for calculating background growth were debated by economists, legislators and others involved in the creation of the Economic Advancement Tax Incentive (EATI) program, the precursor to VEGI. A review of EATI conducted by the State Auditor’s Office (SAO) in 2000 criticized the use of industry average background growth and suggested VEPC reconsider this methodology.
A State Auditor’s Office (SAO) 2008 VEGI audit noted in two cases reviewed that the use of an industry average growth rate provided higher incentive awards than would have been the case had the company’s own growth rate been utilized. At the time, SAO suggested the Joint Fiscal Committee (JFC), which has statutory authority for approving the cost-benefit model used to calculate the value of the incentive award, review this area and use a company’s historical rate of growth, if it’s higher than the industry average. In 2009, VEPC provided information to the JFC about the use and impact of background growth rates in the VEGI incentive calculation. Consequently, the JFC voted to request that relevant legislative committees reexamine the VEGI program.
More recently, the 2016 TWG, charged with reporting to the JFC and other legislative committees, was unable to reach a consensus recommendation about whether the program could integrate the use of business-specific background growth rates.
We decided to conduct this audit because of this debate and concerns that if the industry average growth rates tend to be significantly lower than a company’s actual average growth rate, the State could be providing an incentive for economic activity that would have occurred anyway. Thus, our audit objective was to estimate the extent to which the use of actual applicant growth rates (rather than industry averages) could influence VEPC’s determination of the payroll/job growth to incent and the size of the resulting VEGI incentive for select companies.
Background
Through calendar year 2024, VEPC had considered about $118 million in VEGI awards for 148 applications, some of which were denied, and others cancelled for reasons such as a final application wasn’t filed or performance requirements weren’t met or maintained. Of the total considered, 74 awards totaling $67.4 million are either active (i.e., able to earn and receive incentives), or the applicants completed the program, earning all or some of their incentive award.
Subsequent to approval of an incentive award by VEPC, companies must file an annual VEGI claim indicating that annual performance requirements have been met. If performance requirements are met, the annual incentive is earned and will be paid out in five annual installments if the performance requirements are maintained. Annual performance requirements include maintenance of base full-time payroll, and that the new qualifying payroll requirement is met. The Vermont Department of Taxes (VDT) reviews the data submitted in the annual VEGI claim.1 According to VEPC’s annual VEGI report for 2025, almost $41.5 million in incentives have been paid through 2023.
Statute requires that VEPC determine the fiscal benefits and costs to the state of an applicant’s proposed economic activity. VEPC uses a Cost-Benefit Model to project the net fiscal benefit to the State from the expected economic activity. Specifically, net fiscal benefit is estimated using an economic model that considers effects arising from new jobs, payroll, and capital investment (for plant and equipment) on state revenues (e.g., personal income tax, corporate tax, property tax, etc.) and related state costs (e.g., services, school costs, etc.).
The Cost-Benefit Model also accounts for background growth and excludes it from the incentive calculation based on industry average growth rates. These rates are calculated based on average growth rate for wages and salary measured over fifteen years for the 2-digit or 3- digit industries represented in the North American Industry Classification System (NAICS) with the choice determined by the availability of representative data.2 According to the VEGI Industry Background Growth Rate Chart, rates range from 0 percent to 6.9 percent (capped at 1.5 times the average private sector growth rate).
Details of the Cost-Benefit Model, including industry background growth rates, are approved by the JFC.
Objective 1: For 21 Awards, Use of Company Specific Background Growth Rates Would Have Resulted in Reduced Incentives Totaling an Estimated $8.4 Million
For 21 awards, selected for review based on availability of employment data, we estimate that the total incentives awarded would have decreased by about $8.4 million if company specific average growth rate is used as the background growth rate (company specific BGR) in the incentive calculation, rather than the industry averages (industry BGR) used by VEPC.3 Further, the average incentive award would be reduced by about one-third, falling from $853,684 to $592,583 and several businesses would not have received an incentive.4 These estimated reductions are because the industry BGR used in VEPC’s incentive calculation is lower than the company specific BGR for eleven of the twenty-one awards in our sample and substituting the higher company specific BGR has the effect of decreasing the incentive award. For these instances, where the company specific BGR is higher than the industry BGR, it’s possible the State paid for growth that would have occurred without the public incentives. In contrast, for the ten other awards, where the industry BGR exceeds the company specific BGR, the incentive amounts calculated using industry BGRs are 75 percent of what they would have been if they were calculated using the company specific BGRs. In other words, had the company specific BGR been used to determine the incentive amount for these companies, on average awards would have been approximately $213,000 higher.
Impact on Incentive Awards
Of the 21 awards we reviewed, more than half (52.4 percent) had industry BGRs that were lower than company specific BGRs, as shown in Exhibit 1. The remainder had industry BGRs that were greater than the corresponding company specific BGR.

As shown in Exhibit 1, when using company specific BGR, which was higher for 11 of the sample awards, the average incentive award is estimated to decrease about $261,000 (= $853,684 - $592,583) and five awards were reduced to $0. As a rule, for any given project, the higher the BGR, the lower the incentives paid out by the State. The converse is true, as well, so that the lower the BGR, the higher the incentives paid by the State.
Because VEPC used industry BGRs that were lower than company BGRs in about one-half of the awards we reviewed, if these companies’ historical growth rates are representative of the growth that would have occurred without the incentive award, the State is paying for job growth these companies may have achieved anyway.
Differences in Growth Rates
We utilized nine to sixteen years of payroll employment data from the VDT to calculate company specific average historic growth rates for the 21 incentive awards (28 percent of active and completed incentive awards through December 2024). Using these growth rates to represent background growth (i.e., company specific BGR), we noted significant differences between industry BGR and company specific BGR for several incentive awards. Six awards were to companies whose company specific BGR was 15 percent or more, and three of these awards were to companies who averaged more than 40 percent job growth, when the industry BGR for these six were all less than five percent. In contrast, ten awards were to companies whose company specific BGR was negative or below 3.0 percent when the industry BGR ranged from 0 percent to 6.9 percent.
The graph in Exhibit 2 shows the 21 incentive awards and the extent to which, for these awards, a company’s historic average growth rate was higher or lower than the industry average growth rate used in the incentive calculation.
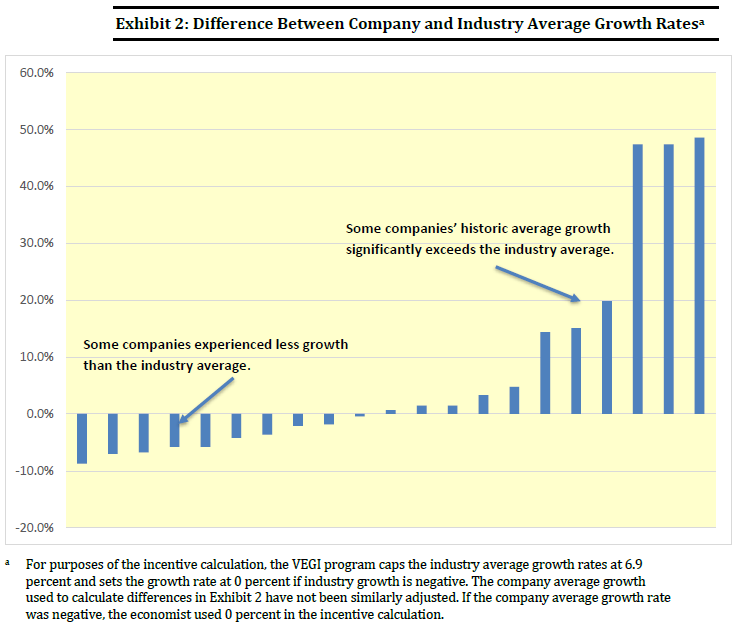
Based on the data in Exhibit 2, for the 21 awards we reviewed, industry BGR is generally not representative of company average growth rates and thus may not be a useful or accurate guide to future job growth as a basis for incentive-setting. Unfortunately, there is no standard definition or method for measuring background growth. There are no examples or discussions in economic literature concerning controlling for background rates when designing economic development programs, and so there is little to draw on regarding a tested approach.
Conclusions
Accounting for background growth and excluding it from the incentive calculation is meant to maximize the State’s fiscal gain and to help limit public exposure to fiscal loss from the program and is required by statute. However, our work uncovered significant differences between the industry average growth rates used to represent background growth and companies’ average growth rates for several of the incentive awards in our sample. These differences suggest that industry average growth rates may not be the best barometer for background growth rates. While the appropriate discount factor for representing background growth has long been debated, the data we present in this report can be used to inform discussion about the best growth rate to use to avoid providing an incentive for economic activity that would have occurred anyway.
Recommendation
In light of the data presented, consider replacing the current methodology with one using company specific average growth rates.
Response by VEPC (Agency of Commerce)
Signed by John Russell, III, VEPC Chair, and Jessica Hartleben, Esq., Executive Director.
VEPC maintains that the program’s design ensures that incentives are only paid after performance targets are met and verified, maintaining accountability and transparency in the use of public funds.
VEPC’s response suggests the report only provides a framework for continued evaluation and improvement of Vermont’s economic development strategies, and its conclusions should be viewed with caution. VEPC also suggests that alternatives might not be accurate or appropriate. VEPC also maintains that changes to methodology likely would require legislative action.
Russell and Hartleben wrote in part: “In conclusion, the VEGI program has operated for nearly two decades with verified, performance-based incentives and has meaningfully contributed to economic activity across Vermont. This report renews discussion on a recognized policy question regarding methodology, and its findings should be interpreted with caution. Considering the limitations described above, the report does not demonstrate that the VEGI program is overpaying incentives, nor does it establish that the alternative approach is more accurate or appropriate.”
NOTES:
New qualifying employment means the job is new in Vermont and is full-time. Other requirements for qualification include an hourly wage that is more than 140 percent or 160 percent of the Vermont minimum wage (depending on the labor market area in which the project will occur) for the year in which the project starts. Further, these employees must be eligible for at least three of eight benefits from a menu of benefits that includes various insurances (health and dental), childcare, and paid vacation time.
When industries have too few firms to maintain anonymity at a given industrial classification level, U.S. and state statistical agencies suppress publication of figures and report at the next highest classification level to prevent disclosure of individual firm data. NAICS classifications are most detailed at a 6-digit level of specificity. See https://www.census.gov/naics/reference_files_tools/2022_NAICS_Manual.pdf for the classification for each industry.
Company specific BGR was calculated based on employment data in companies’ VDT income tax withholding accounts and includes a minimum of nine years of data prior to the incentive award period.
Some of the awards in our sample included a labor market area (LMA) enhancement which is a discretionary adjustment VEPC may make to increase an incentive amount under certain circumstances. Because this is a discretionary adjustment, the calculation of the effect of using company specific BGR in place of industry BGR compares the incentive calculated prior to any enhancement approved by VEPC.
According to the economist, there were 37 awards to businesses that had at least nine years of data history in the NETS database. SAO requested that VDT provide historic employment and wage data for these businesses.
Source: 5.13.2026. Vermont Auditor of Accounts.
To support vital journalism, access our archives and get unique features like our award-winning profiles, Book of Lists & Business-to-Business Directory, subscribe HERE!
 Vermont Business Magazine