by Timothy McQuiston, Vermont Business Magazine Today, the Vermont Department of Labor reported that the seasonally adjusted statewide unemployment rate for March was 2.6 percent. This reflects no change from the prior month’s revised estimate, as based on household data. The comparable United States rate in March was 4.3 percent, a decrease of one-tenth of one percentage point from the revised February estimate.
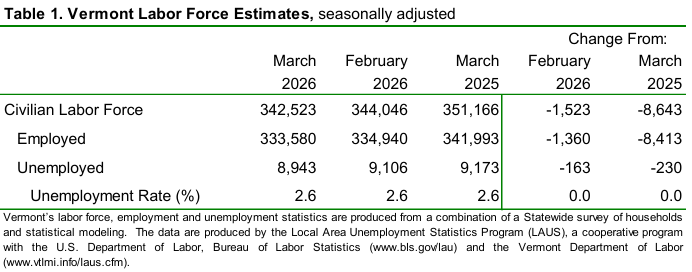
The seasonally adjusted Vermont data for March show the Vermont civilian labor force decreased by 1,523 from the prior month’s revised estimate (see Table 1). The number of employed persons decreased by 1,360 and the number of unemployed persons decreased by 163.
The Labor Force is down 8,643 workers from March 2025 and employment is down 8,413 jobs. The drop in the Labor Force offsets the drop in Employed, which accounts for there being no change in the unemployment rate. Total unemployed decreased 230 for the year. None of the changes were statistically significant in the seasonally adjusted series.
The civilian labor force participation rate was 62.9 percent in March, a decrease of three-tenths of one percentage point from the prior month’s revised estimate.
Vermont has the fourth lowest jobless rate in the nation, with South Dakota lowest (2.3%) and Delaware highest (5.4%).
See tables below.
“Every year, March is a period of transition in Vermont – not only because of the weather but also because of seasonal industries. The over-the-year data for March 2026 gives a preliminary indication of a strong winter hiring season for Leisure & Hospitality businesses,” said Kendal Smith, Commissioner of the Vermont Department of Labor. “Looking forward, many industries will be ramping up hiring activities as the weather improves. To support these hiring efforts, the Department has multiple hiring events this month. To learn more about these events, as either a jobseeker or a hiring employer, you can visit https://www.vermontjoblink.com/events for the most up to date information.”
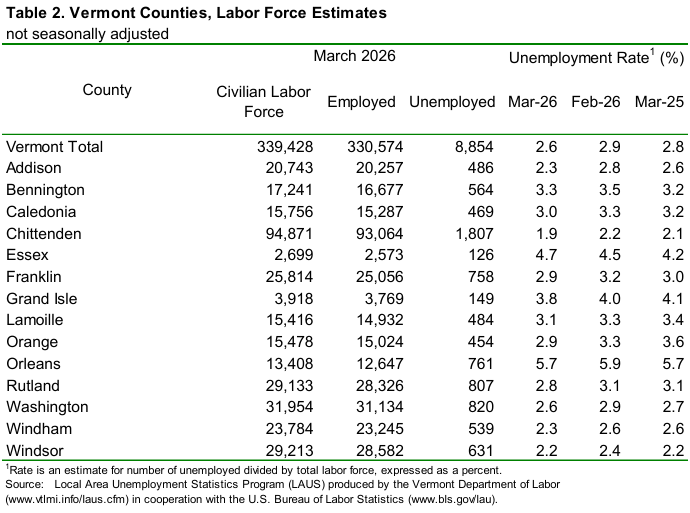
The March unemployment rates for Vermont’s 14 counties ranged from 1.9 percent in Chittenden County to 5.7 percent in Orleans County (note: county unemployment rates are not seasonally-adjusted – see Table 2). For comparison, the March unadjusted unemployment rate for Vermont was 2.6 percent, a decrease of three-tenths of one percentage point from the revised unadjusted February level and a decrease of two-tenths of one percentage point from a year ago.
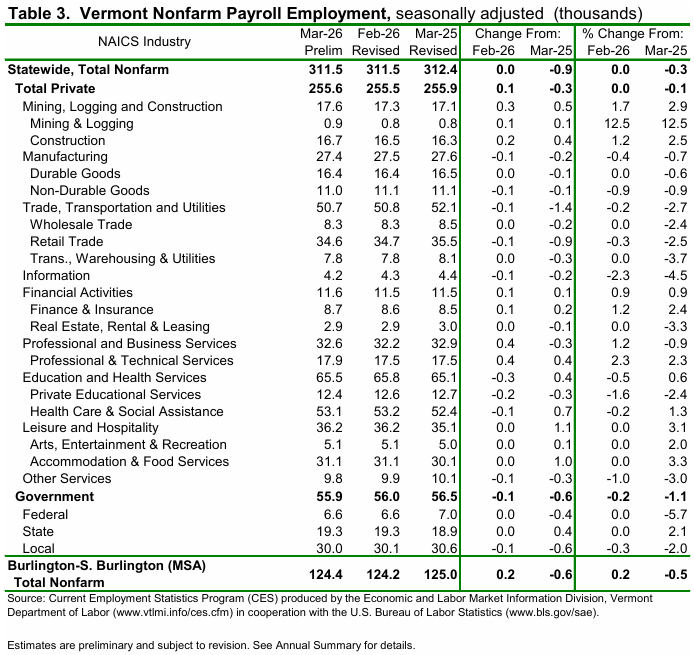
Seasonally Adjusted (Table 3)
The seasonally adjusted data for March reported no change from the revised February data. There was a decrease of 200 jobs between the preliminary and the revised February estimates due to the inclusion of more data. The seasonally adjusted over-the-month changes in March varied at the industry level. The industries with a notable increase were: Professional & Technical Services (+400 jobs or +2.3%) and Construction (+200 jobs or +1.2%). The industry with a notable decrease was Private Educational Services (-200 jobs or -1.6%).
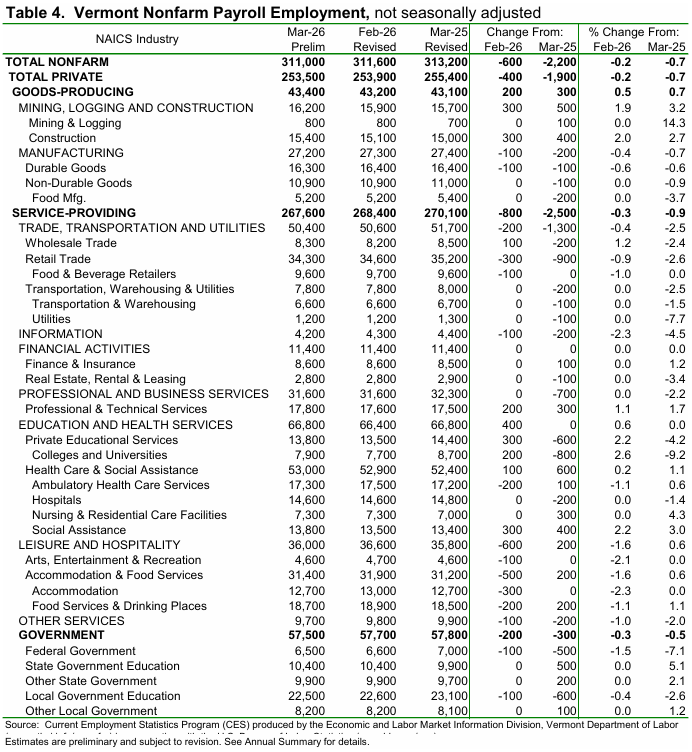
Not-Seasonally-Adjusted (Table 4)
The preliminary ‘not-seasonally-adjusted’ jobs estimates for March showed a decrease of 600 jobs when compared to the revised February numbers. As with the seasonally adjusted data, this over-the-month change is from the revised February numbers which experienced no change from the preliminary estimates. The broader economic picture can be seen by focusing on the over-the-year changes in this data series. As detailed in the preliminary not-seasonally-adjusted March data, Total Private industries decreased by 1,900 jobs (-0.7%) over the year and Government (including public education) employment decreased by 300 jobs (-0.5%) in the past year.
*** BLS note on CES series drops in 2026: https://www.bls.gov/sae/notices/2026/notice-of-publication-changes-with-the-release-of-March-2026-data.htm ***
The Unemployment and Jobs Report for April is scheduled to be released on Friday, May 22, 2026, at 10:00 a.m.
3.6.2026. Montpelier, VT labor.vermont.gov
| State | March 2026(p) rate |
Rank |
|---|---|---|
|
South Dakota |
2.3 | 1 |
|
Hawaii |
2.4 | 2 |
|
North Dakota |
2.5 | 3 |
|
Vermont |
2.6 | 4 |
|
Alabama |
2.7 | 5 |
|
Nebraska |
3.1 | 6 |
|
New Hampshire |
3.1 | 6 |
|
Maine |
3.2 | 8 |
|
Indiana |
3.3 | 9 |
|
Iowa |
3.3 | 9 |
|
Georgia |
3.5 | 11 |
|
Wisconsin |
3.5 | 11 |
|
Idaho |
3.6 | 13 |
|
Montana |
3.6 | 13 |
|
Tennessee |
3.6 | 13 |
|
Wyoming |
3.6 | 13 |
|
North Carolina |
3.7 | 17 |
|
Mississippi |
3.8 | 18 |
|
Utah |
3.8 | 18 |
|
Virginia |
3.8 | 18 |
|
Colorado |
3.9 | 21 |
|
Kansas |
3.9 | 21 |
|
Missouri |
3.9 | 21 |
|
Oklahoma |
3.9 | 21 |
|
Ohio |
4.1 | 25 |
|
Kentucky |
4.2 | 26 |
|
Pennsylvania |
4.2 | 26 |
|
Arkansas |
4.3 | 28 |
|
Maryland |
4.3 | 28 |
|
Texas |
4.3 | 28 |
|
Louisiana |
4.4 | 31 |
|
Minnesota |
4.5 | 32 |
|
West Virginia |
4.5 | 32 |
|
New York |
4.6 | 34 |
|
Alaska |
4.7 | 35 |
|
Arizona |
4.7 | 35 |
|
Florida |
4.7 | 35 |
|
Massachusetts |
4.7 | 35 |
|
Rhode Island |
4.7 | 35 |
|
Connecticut |
4.8 | 40 |
|
New Mexico |
4.8 | 40 |
|
New Jersey |
4.9 | 42 |
|
South Carolina |
4.9 | 42 |
|
Michigan |
5.0 | 44 |
|
Illinois |
5.1 | 45 |
|
Washington |
5.1 | 45 |
|
Oregon |
5.2 | 47 |
|
California |
5.3 | 48 |
|
Nevada |
5.3 | 48 |
|
Delaware |
5.4 | 50 |
|
District of Columbia |
6.3 | 51 |
|
Footnotes |
||
|
Note: Rates shown are a percentage of the labor force. Data refer to place of residence. Estimates for the current month are subject to revision the following month. |
||
Last Modified Date: May 6, 2026