
by Timothy McQuiston, Vermont Business Magazine Today, the Vermont Department of Labor reported that the seasonally adjusted statewide unemployment rate for December was 2.6%. This reflects no change from the prior month’s revised estimate. Vermont has the third-lowest rate in the nation behind a tie behind Hawaii and South Dakota (2.2%). California has the highest rate at 5.5%.
The comparable United States rate in December was 4.4%, a decrease of one-tenth of one percentage point from the revised November estimate.
The civilian labor force participation rate was 64.0% in December, a decrease of two-tenths of one percentage point from the prior month’s revised estimate.
The data continues to show significant reductions in the Labor Force and Employed month-to-month and year-to-year. The Labor Force is the denominator in the equations, so when it goes down it minimizes the losses in the Employed category. The number of Unemployed is essentially unchanged.
See data tables below.
"The Vermont Department of Labor works directly with employers to help them hire, retain, and support the workers they need to succeed,” said Kendal Smith, Vermont Department of Labor Commissioner. “At the same time, we are helping Vermonters connect with available job opportunities as labor market conditions shift. Maximizing every working Vermonter’s potential helps workers build sustainable careers while strengthening and stabilizing Vermont businesses. Through partnerships with local Department of Labor offices (https://labor.vermont.gov/workforce-development/job-centers), businesses can access customized services and resources, while workers can explore additional training or education options to support their next steps.”
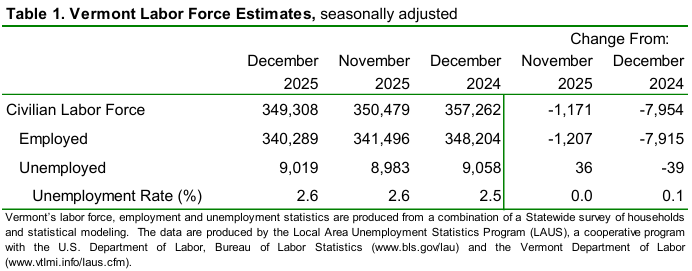
The seasonally adjusted Vermont data for December show the Vermont civilian labor force decreased by 1,171 from the prior month’s revised estimate (see Table 1). The number of employed persons decreased by 1,207 and the number of unemployed persons increased by 36. The changes to the labor force and the number of employed persons were statistically significant in the seasonally adjusted series.
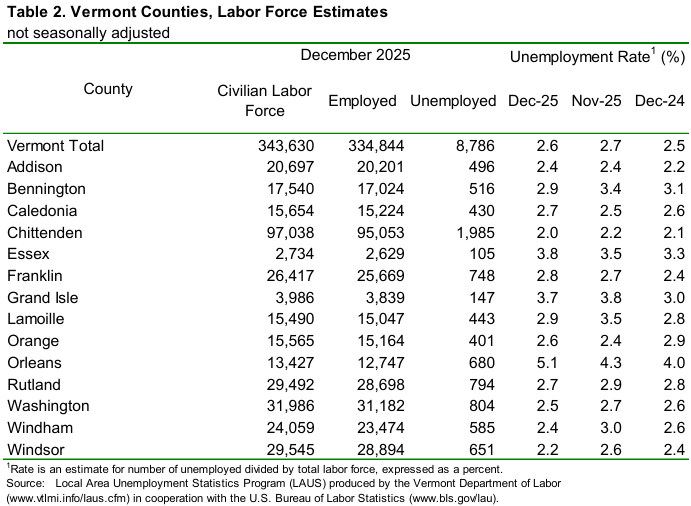
The December unemployment rates for Vermont’s 14 counties ranged from 2.0 percent in Chittenden County to 5.1 percent in Orleans County (note: county unemployment rates are not-seasonally-adjusted – see Table 2). For comparison, the December unadjusted unemployment rate for Vermont was 2.6 percent, a decrease of one-tenth of one percentage point from the revised unadjusted November level and an increase of one-tenth of one percentage point from a year ago.
*** BLS note on LAUS geography and data changes in 2025: https://www.bls.gov/lau/geography-and-data-changes-in-2025.htm ***
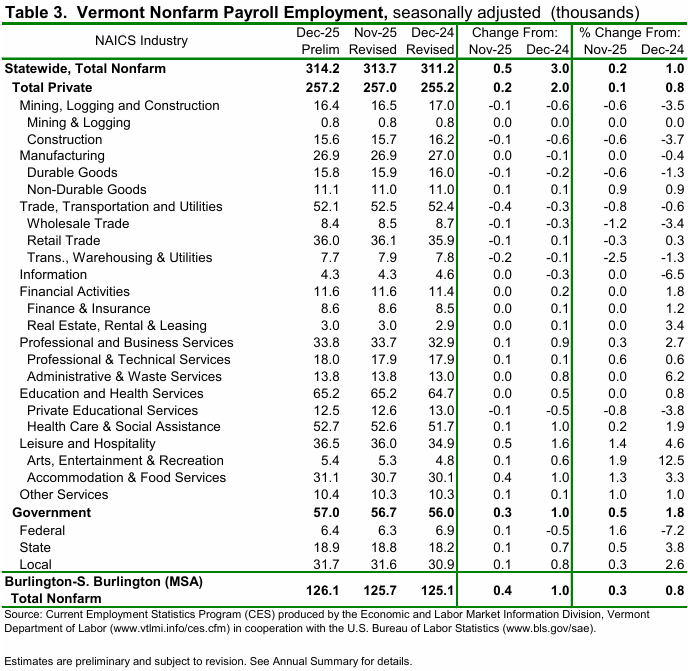
Seasonally Adjusted (Table 3) The seasonally adjusted data for December reported an increase of 500 jobs from the revised November data. There was no change between the preliminary and the revised November estimates due to the inclusion of more data. The seasonally adjusted over-the-month changes in December varied at the industry level. The industry with a notable increase was Accommodation & Food Services (+400 jobs or +1.3%). The industry with a notable decrease was Transportation, Warehousing, & Utilities (-200 jobs or -2.5%).
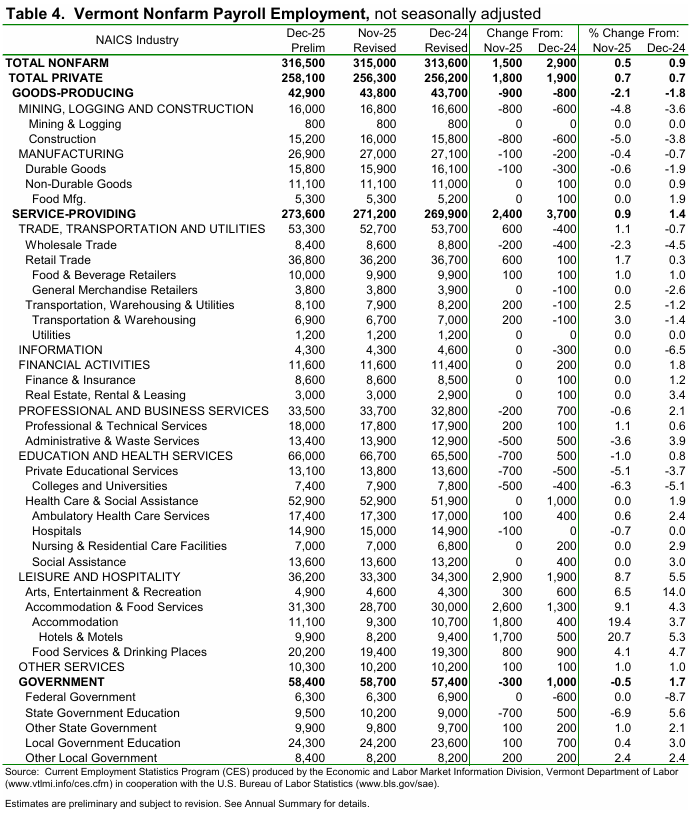
Not-Seasonally-Adjusted (Table 4) The preliminary ‘not-seasonally-adjusted’ jobs estimates for December showed an increase of 1,500 jobs when compared to the revised November numbers. As with the seasonally adjusted data, this over-the-month change is from the revised November numbers which experienced a decrease of 200 jobs from the preliminary estimates. The broader economic picture can be seen by focusing on the over-the-year changes in this data series. As detailed in the preliminary not seasonally adjusted December data, Total Private industries increased by 1,900 jobs (+0.7%) over the year and Government (including public education) employment increased by 1,000 jobs (+1.7%) in the past year.
The schedule for the Unemployment and Jobs Reports for 2026 data releases is yet to be set; please visit www.vtlmi.info for the latest data and the 2026 schedule, once released.
| State | December 2025(p) rate |
Rank |
|---|---|---|
|
Hawaii |
2.2 | 1 |
|
South Dakota |
2.2 | 1 |
|
North Dakota |
2.6 | 3 |
|
Vermont |
2.6 | 3 |
|
Alabama |
2.7 | 5 |
|
Nebraska |
3.0 | 6 |
|
New Hampshire |
3.1 | 7 |
|
Wisconsin |
3.1 | 7 |
|
Maine |
3.2 | 9 |
|
Montana |
3.4 | 10 |
|
Wyoming |
3.4 | 10 |
|
Indiana |
3.5 | 12 |
|
Iowa |
3.5 | 12 |
|
Georgia |
3.6 | 14 |
|
Idaho |
3.6 | 14 |
|
Oklahoma |
3.6 | 14 |
|
Tennessee |
3.6 | 14 |
|
Utah |
3.6 | 14 |
|
Virginia |
3.6 | 14 |
|
Mississippi |
3.7 | 20 |
|
Colorado |
3.8 | 21 |
|
Kansas |
3.8 | 21 |
|
Missouri |
3.9 | 23 |
|
North Carolina |
3.9 | 23 |
|
Minnesota |
4.1 | 25 |
|
Arkansas |
4.2 | 26 |
|
Connecticut |
4.2 | 26 |
|
Louisiana |
4.2 | 26 |
|
Maryland |
4.2 | 26 |
|
Pennsylvania |
4.2 | 26 |
|
Arizona |
4.3 | 31 |
|
Florida |
4.3 | 31 |
|
New Mexico |
4.3 | 31 |
|
Rhode Island |
4.3 | 31 |
|
Texas |
4.3 | 31 |
|
Kentucky |
4.5 | 36 |
|
Ohio |
4.5 | 36 |
|
Illinois |
4.6 | 38 |
|
New York |
4.6 | 38 |
|
West Virginia |
4.6 | 38 |
|
Washington |
4.7 | 41 |
|
Alaska |
4.8 | 42 |
|
Massachusetts |
4.8 | 42 |
|
South Carolina |
4.8 | 42 |
|
Michigan |
5.0 | 45 |
|
Delaware |
5.2 | 46 |
|
Nevada |
5.2 | 46 |
|
Oregon |
5.2 | 46 |
|
New Jersey |
5.4 | 49 |
|
California |
5.5 | 50 |
|
District of Columbia |
6.7 | 51 |
|
Footnotes |
||
|
Note: Rates shown are a percentage of the labor force. Data refer to place of residence. Estimates for the current month are subject to revision the following month. |
||
Last Modified Date: January 27, 2026
To support vital journalism, access our archives and get unique features like our award-winning profiles, Book of Lists & Business-to-Business Directory, subscribe HERE!
