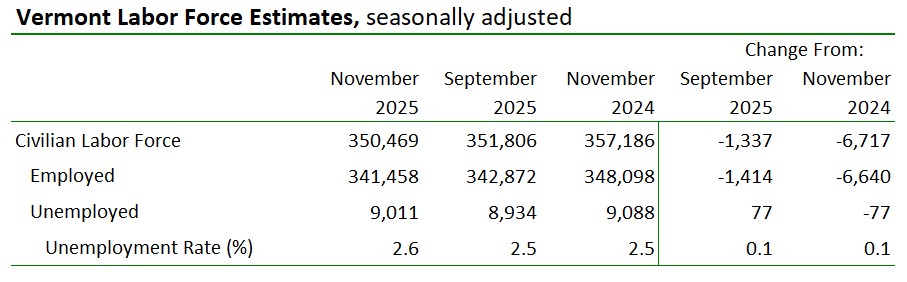
by Timothy McQuiston, Vermont Business Magazine Today, the Vermont Department of Labor released data on the Vermont economy for the time period covering November 2025. According to household data, the seasonally adjusted statewide unemployment rate for November was 2.6 percent. This reflects an increase of one-tenth of one percentage point from September’s revised estimate. The civilian labor force participation rate was 64.2 percent in November, a decrease of two-tenths of one percentage point from September’s revised estimate.
All three major indices showed weakness.
The seasonally adjusted Vermont data for November show the Vermont civilian labor force decreased by 1,337 from September’s revised estimate (see Table 1). The number of employed persons decreased by 1,414 and the number of unemployed persons increased by 77 over the same time period. The change to the number of employed persons was statistically significant in the seasonally adjusted series.
The comparable United States rate in November was 4.6 percent, an increase of two-tenths of one percentage point from the revised September estimate. Vermont is tied for the third lowest unemployment rate with North Dakota. South Dakota is lowest (2.1%), Hawaii is second (2.2%) and California is highest (5.5%).
See Tables Below.
*** Note: The monthly data programs are still being impacted by the federal shutdown that occurred last fall. The jobs data, as provided by Vermont businesses, was able to produce estimates for October and November - both of which are contained in this release. For topics like the number of employed Vermonters, unemployed Vermonters and ultimately, the unemployment rate, there was no monthly data collection completed for October so estimates cannot be produced. For household concepts, like the unemployment rate, this release includes updated September data, preliminary November data but again, no estimates for October. Regular data processing has resumed and is on track for the December data release scheduled for January 27, 2026. ***
“The numbers tell a story beyond statistics—they represent Vermonters looking for work and local businesses trying to hire. Helping people connect with jobs close to home is key to keeping Vermont’s communities strong and our economy moving forward,” said Kendal Smith, Vermont Department of Labor Commissioner. “Over the next few weeks, the Department will be sharing information about upcoming job fairs, hiring events, and other employment opportunities. For the latest news and resources, please visit https://labor.vermont.gov/ .”
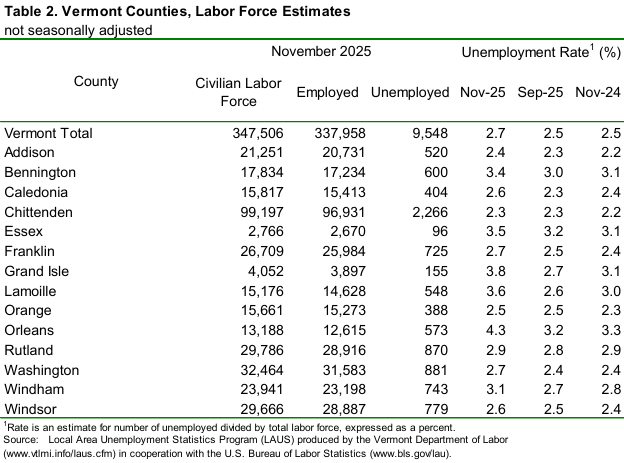
The November unemployment rates for Vermont’s 14 counties ranged from 2.3 percent in Chittenden County to 4.3 percent in Orleans County (note: county unemployment rates are not seasonally-adjusted – see Table 2). For comparison, the November unadjusted unemployment rate for Vermont was 2.7 percent, an increase of two-tenths of one percentage point from the revised unadjusted September level and an increase of two-tenths of one percentage point from a year ago.
*** BLS note on LAUS geography and data changes in 2025: https://www.bls.gov/lau/geography-and-data-changes-in-2025.htm ***
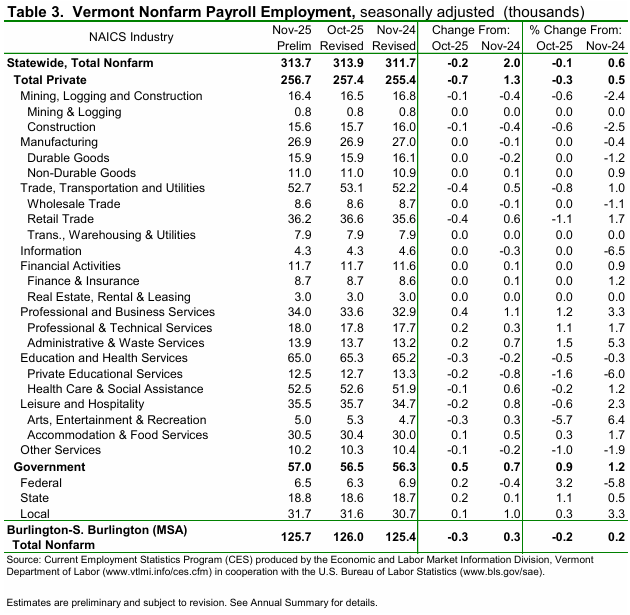
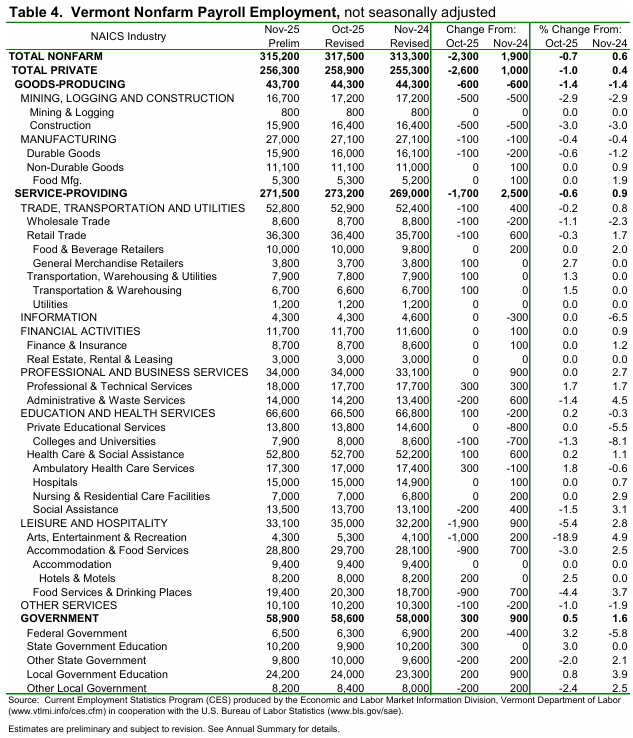
The seasonally adjusted data for November reported a decrease of 200 jobs from the revised October data. The seasonally adjusted over-the-month changes in November varied at the industry level. The industries with a notable increase were: Federal Government (+200 jobs or +3.2%), Administrative & Waste Services (+200 jobs or +1.5%), and Professional & Technical Services (+200 jobs or +1.1%). The industries with a notable decrease were: Arts, Entertainment & Recreation (-300 jobs or -5.7%), Private Educational Services (-200 jobs or -1.6%), and Retail Trade (-400 jobs or -1.1%). Not-Seasonally-Adjusted (Table 4) The preliminary ‘not-seasonally-adjusted’ jobs estimates for November showed a decrease of 2,300 jobs when compared to the revised October numbers. The broader economic picture can be seen by focusing on the over-the-year changes in this data series. As detailed in the preliminary not-seasonally-adjusted November data, Total Private industries increased by 1,000 jobs (+0.4%) over the year and Government (including public education) employment increased by 900 jobs (+1.6%) in the past year.
US Workers Will Continue Job Hugging
Eagle Hill Consulting Employee Retention Index Signals Continued Worker Retention Stability Through Q2 2026, Remaining Near Historic High
Millennial Workers Most Likely to Stay Put, While Employee Views on Job Market Opportunity Weaken
The latest Eagle Hill Consulting Employee Retention Index (January 7, 2026) closes 2025 at 105.0, down just 0.8 points from last period, but still well above where the year began. This marks the end of a year of pronounced strengthening in U.S. workforce retention outlook, with the Index climbing from 98.5 at the close of 2024 to 105.0 by the end of 2025. This substantial increase reflects employees' higher confidence in organizations, improved cultural satisfaction, more favorable compensation perceptions, and waning opinions of the job market.![]()
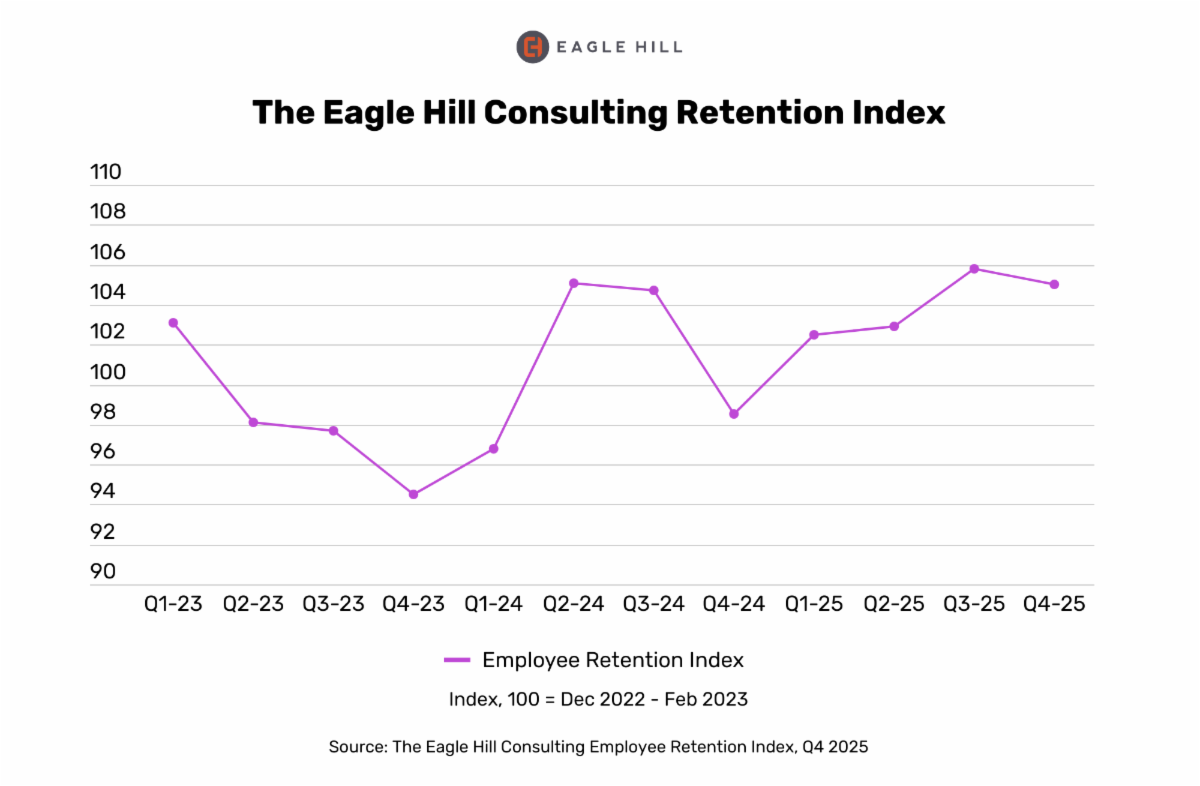
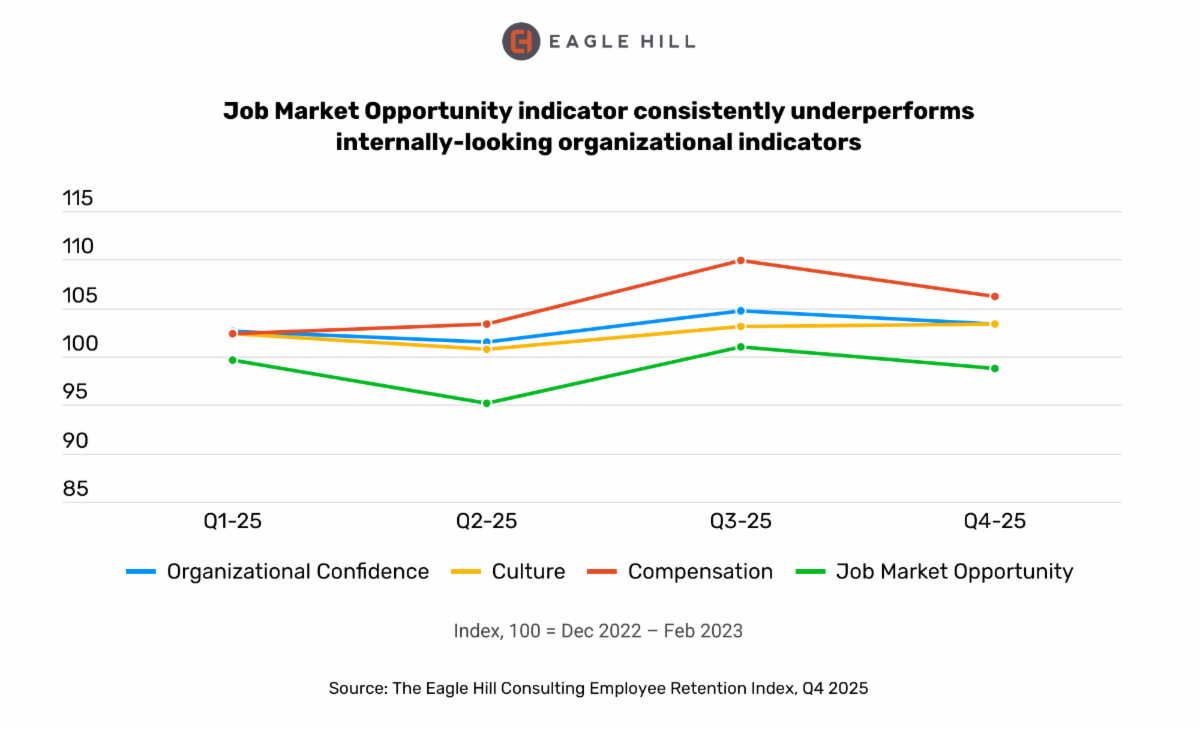
All four Eagle Hill Consulting Retention Index sub-indicators – Culture, Compensation, Organizational Confidence, and Job Market Opportunity – shifted this quarter. The Culture Indicator rose 0.2 points, while the Organizational Confidence Indicator fell 1.3 points. The Compensation Indicator dropped 3.7 points, and the Job Market Opportunity Indicator declined 2.3 points to 98.7, continuing is fourth consecutive run as the weakest performing sub-indicator.![]()
"The Eagle Hill Employee Retention Index tells a compelling story about the close of 2025," said Melissa Jezior, president and chief executive officer of Eagle Hill Consulting. "Despite a typical year-end dip, U.S. workers are entering 2026 more likely to stay with their employers than they were coming into 2025. Employees are anchoring onto the relative stability of their current roles as they see fewer viable or attractive external opportunities. The data indicate that workers are staying because they feel increasingly satisfied with their organizational culture and compensation, as their views of the job market soften."
"But while high retention rates might seem ideal, it could be problematic for employers who made need to downsize their workforce. Also, the tight job market could mask underlying issues if employees are staying out of fear rather than engagement," Jezior added. "As such, this is a critical moment for employers to understand why their people are staying. And with workers more committed to staying, organizations have a prime opportunity to strengthen their talent pipeline, upskill their workforce, and address skill gaps that may have gone unnoticed during high-turnover periods."
The findings follow the latest U.S. Bureau of Labor Statistics (BLS) Job Openings and Labor Turnover Survey (JOLTS) data that revealed that job openings remained unchanged at 7.7 million in October 2025, with both hires and total separations little changed at 5.1 million. Within separations, quits remained steady at 2.9 million and layoffs at 1.9 million. The stagnation in hiring and turnover reflects a labor market where both employers and workers are exercising caution, with workers staying put amid limited external opportunities, a trend that aligns closely with the Eagle Hill Retention Index findings.
| State | November 2025(p) rate |
Rank |
|---|---|---|
|
South Dakota |
2.1 | 1 |
|
Hawaii |
2.2 | 2 |
|
North Dakota |
2.6 | 3 |
|
Vermont |
2.6 | 3 |
|
Alabama |
2.7 | 5 |
|
Nebraska |
3.0 | 6 |
|
New Hampshire |
3.0 | 6 |
|
Wisconsin |
3.1 | 8 |
|
Maine |
3.2 | 9 |
|
Montana |
3.3 | 10 |
|
Wyoming |
3.4 | 11 |
|
Georgia |
3.5 | 12 |
|
Iowa |
3.5 | 12 |
|
Oklahoma |
3.5 | 12 |
|
Virginia |
3.5 | 12 |
|
Tennessee |
3.6 | 16 |
|
Utah |
3.6 | 16 |
|
Idaho |
3.7 | 18 |
|
Indiana |
3.7 | 18 |
|
Kansas |
3.8 | 20 |
|
Mississippi |
3.8 | 20 |
|
North Carolina |
3.8 | 20 |
|
Colorado |
3.9 | 23 |
|
Connecticut |
4.0 | 24 |
|
Minnesota |
4.0 | 24 |
|
Missouri |
4.0 | 24 |
|
Arkansas |
4.1 | 27 |
|
Florida |
4.2 | 28 |
|
Maryland |
4.2 | 28 |
|
New Mexico |
4.2 | 28 |
|
Pennsylvania |
4.2 | 28 |
|
Texas |
4.2 | 28 |
|
Arizona |
4.3 | 33 |
|
Louisiana |
4.3 | 33 |
|
Rhode Island |
4.3 | 33 |
|
Illinois |
4.4 | 36 |
|
West Virginia |
4.4 | 36 |
|
New York |
4.5 | 38 |
|
Ohio |
4.5 | 38 |
|
South Carolina |
4.6 | 40 |
|
Washington |
4.6 | 40 |
|
Alaska |
4.7 | 42 |
|
Kentucky |
4.7 | 42 |
|
Massachusetts |
4.7 | 42 |
|
Delaware |
4.9 | 45 |
|
Michigan |
5.0 | 46 |
|
Nevada |
5.2 | 47 |
|
Oregon |
5.2 | 47 |
|
New Jersey |
5.4 | 49 |
|
California |
5.5 | 50 |
|
District of Columbia |
6.5 | 51 |
|
Footnotes |
||
|
Note: Rates shown are a percentage of the labor force. Data refer to place of residence. Estimates for the current month are subject to revision the following month. |
||
Last Modified Date: January 7, 2026
The Unemployment and Jobs Report for December is scheduled to be released on Tuesday, January 27, 2026, at 10:00 a.m. labor.vermont.gov
To support vital journalism, access our archives and get unique features like our award-winning profiles, Book of Lists & Business-to-Business Directory, subscribe HERE!
