
by Timothy McQuiston, Vermont Business Magazine Today, the Vermont Department of Labor released data on the Vermont economy for the time period covering August 2025. According to household data, the seasonally adjusted statewide unemployment rate for August was 2.5 percent. This reflects a decrease of one-tenth of one percentage point from the prior month’s revised estimate. Vermont has the second lowest rate in the nation, tied with North Dakota. South Dakota is lowest at 1.9% and California is highest at 5%.
The Labor Market, which is the denominator in these equations, fell by over 900, which offset a similar decline in the number of employed. Unemployment also fell, but by a slight amount. The civilian labor force participation rate was 64.6 percent in August, a decrease of one-tenth of one percentage point from the prior month’s revised estimate.
Public Assets Insitute reported today that not only has the labor situation weakened, despite the rate drop, but incomes have also stagnated.
“Over the past seven months, an estimated 5,000 Vermonters have left the labor force, in part due to retirements. While demographic shifts present real challenges, this is also an opportunity to continue connecting Vermonters with good jobs, training, and career pathways,” said Kendal Smith, Vermont Department of Labor Commissioner. “Vermont’s economy depends on a strong and engaged workforce—which means we all have a role to play in building it. There are many ways to retain talent and draw more people to Vermont, including housing solutions, education transformation, service opportunities, and everyday training and job support.”
The comparable United States rate in August was 4.3 percent, an increase of one-tenth of one percentage point from the revised July estimate. The seasonally adjusted Vermont data for August show the Vermont civilian labor force decreased by 910 from the prior month’s revised estimate (see Table 1). The number of employed persons decreased by 838 and the number of unemployed persons decreased by 72. No changes were statistically significant in the seasonally adjusted series.
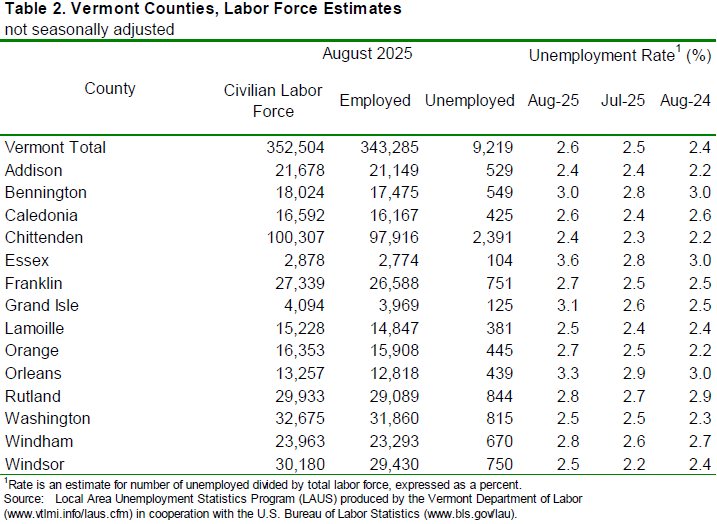
The August unemployment rates for Vermont’s 14 counties ranged from 2.4 percent in Addison and Chittenden Counties to 3.6 percent in Essex County (note: county unemployment rates are not seasonally-adjusted – see Table 2). For comparison, the August unadjusted unemployment rate for Vermont was 2.6 percent, an increase of one-tenth of one percentage point from the revised unadjusted July level and an increase of two-tenths of one percentage point from a year ago.
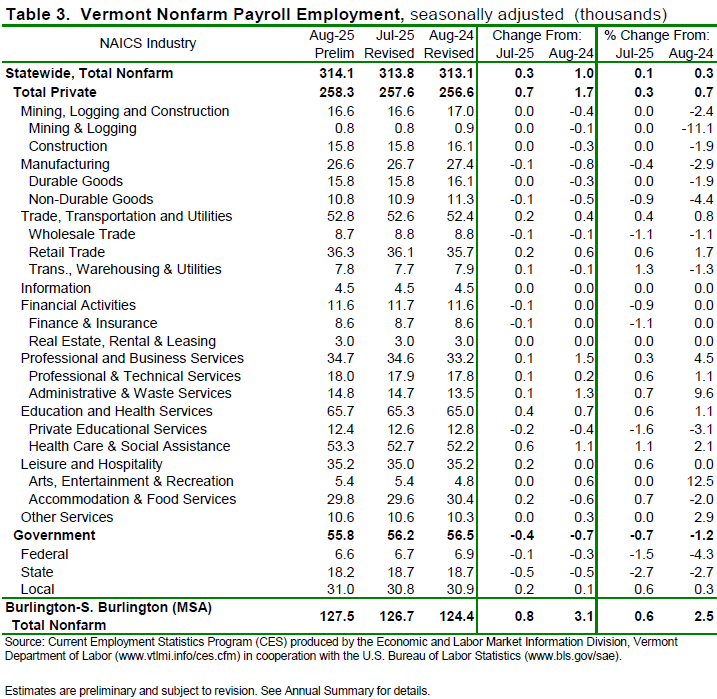
Seasonally Adjusted (Table 3)
The seasonally adjusted data for August reported an increase of 300 jobs from the revised July data. There was a decrease of 400 jobs between the preliminary and the revised July estimates due to the inclusion of more data. The seasonally adjusted over-the-month changes in August varied at the industry level. The industry with a notable increase was Health Care & Social Assistance (+600 jobs or +1.1%). The industries with a notable decrease were: State Government (-500 jobs or -2.7%) and Private Educational Services (-200 jobs or -1.6%).
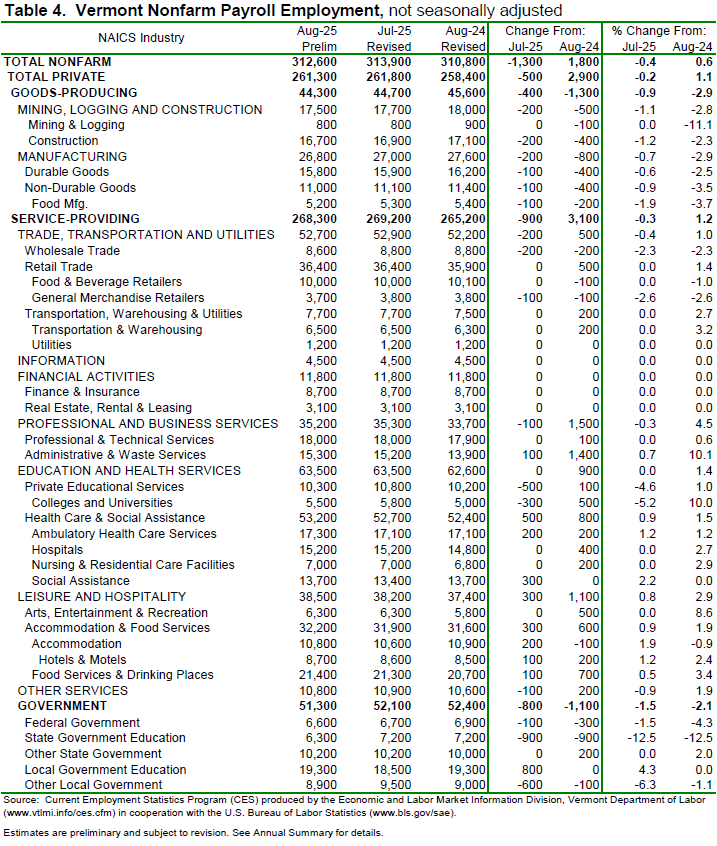
Not-Seasonally-Adjusted (Table 4)
The preliminary ‘not-seasonally-adjusted’ jobs estimates for August showed a decrease of 1,300 jobs when compared to the revised July numbers. As with the seasonally adjusted data, this over-the-month change is from the revised July numbers which experienced a decrease of 700 jobs from the preliminary estimates. The broader economic picture can be seen by focusing on the over-the-year changes in this data series. As detailed in the preliminary not-seasonally-adjusted August data, Total Private industries increased by 2,900 jobs (+1.1%) over the year and Government (including public education) employment decreased by 1,100 jobs (-2.1%) in the past year.
| State | August 2025(p) rate |
Rank |
|---|---|---|
|
South Dakota |
1.9 | 1 |
|
North Dakota |
2.5 | 2 |
|
Vermont |
2.5 | 2 |
|
Hawaii |
2.7 | 4 |
|
Alabama |
2.9 | 5 |
|
Montana |
2.9 | 5 |
|
Nebraska |
3.0 | 7 |
|
New Hampshire |
3.0 | 7 |
|
Oklahoma |
3.1 | 9 |
|
Wisconsin |
3.1 | 9 |
|
Maine |
3.2 | 11 |
|
Wyoming |
3.2 | 11 |
|
Utah |
3.3 | 13 |
|
Georgia |
3.4 | 14 |
|
Indiana |
3.6 | 15 |
|
Maryland |
3.6 | 15 |
|
Minnesota |
3.6 | 15 |
|
Tennessee |
3.6 | 15 |
|
Virginia |
3.6 | 15 |
|
Idaho |
3.7 | 20 |
|
North Carolina |
3.7 | 20 |
|
Arkansas |
3.8 | 22 |
|
Connecticut |
3.8 | 22 |
|
Florida |
3.8 | 22 |
|
Iowa |
3.8 | 22 |
|
Kansas |
3.8 | 22 |
|
West Virginia |
3.8 | 22 |
|
Mississippi |
3.9 | 28 |
|
New York |
4.0 | 29 |
|
Pennsylvania |
4.0 | 29 |
|
Arizona |
4.1 | 31 |
|
Missouri |
4.1 | 31 |
|
New Mexico |
4.1 | 31 |
|
Texas |
4.1 | 31 |
|
Colorado |
4.2 | 35 |
|
Delaware |
4.3 | 36 |
|
South Carolina |
4.3 | 36 |
|
Illinois |
4.4 | 38 |
|
Louisiana |
4.4 | 38 |
|
Washington |
4.5 | 40 |
|
Rhode Island |
4.6 | 41 |
|
Alaska |
4.7 | 42 |
|
Kentucky |
4.7 | 42 |
|
Massachusetts |
4.8 | 44 |
|
New Jersey |
5.0 | 45 |
|
Ohio |
5.0 | 45 |
|
Oregon |
5.0 | 45 |
|
Michigan |
5.2 | 48 |
|
Nevada |
5.3 | 49 |
|
California |
5.5 | 50 |
|
District of Columbia |
6.0 | 51 |
|
Footnotes |
||
|
Note: Rates shown are a percentage of the labor force. Data refer to place of residence. Estimates for the current month are subject to revision the following month. |
||
Last Modified Date: September 19, 2025
The Unemployment and Jobs Report for September is scheduled to be released on Tuesday, October 21, 2025, at 10:00 a.m.
BLS note on LAUS geography and data changes in 2025: https://www.bls.gov/lau/geography-and-data-changes-in-2025.htm
To support vital journalism, access our archives and get unique features like our award-winning profiles, Book of Lists & Business-to-Business Directory, subscribe HERE!
