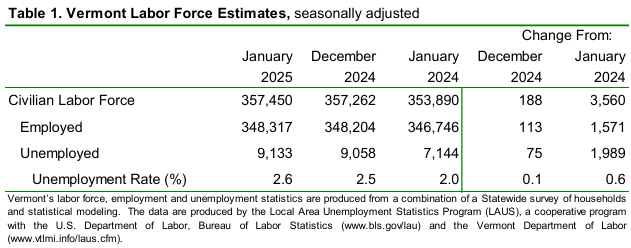
by Timothy McQuiston, Vermont Business Magazine Today, the Vermont Department of Labor announced that the seasonally adjusted statewide unemployment rate for January was 2.6 percent. This reflects an increase of one-tenth of one percentage point from the prior month’s revised estimate. The civilian labor force participation rate was 65.5 percent in January, no change from the prior month’s revised estimate. While the Labor Force, Employment and Unemployment all increased slightly, none of the changes were statistically significant. Vermont continues to have the second lowest rate in the nation, tied with North Dakota. South Dakota is lowest at 1.9 percent; Nevada is highest at 5.8 percent.
The comparable United States rate in January was 4.0 percent, a decrease of one-tenth of one percentage point from the revised December estimate.
The January rate always comes out later as the annual data is revised.
"The average duration of unemployment remains near historic lows, indicating that most individuals are securing new employment relatively quickly after job loss. However, we recognize that even short periods of unemployment can be challenging for individuals and their families. The Department has two critical roles to play during these challenging times – ensuring individuals who lose their job have access to both unemployment and reemployment services, and assisting businesses in finding needed talent. To access our suite of resources and services, visit labor.vermont.gov.”
The seasonally adjusted Vermont data for January show the Vermont civilian labor force increased by 188 from the prior month’s revised estimate (see Table 1). The number of employed persons increased by 113 and the number of unemployed persons increased by 75. None of the changes were statistically significant in the seasonally adjusted series.
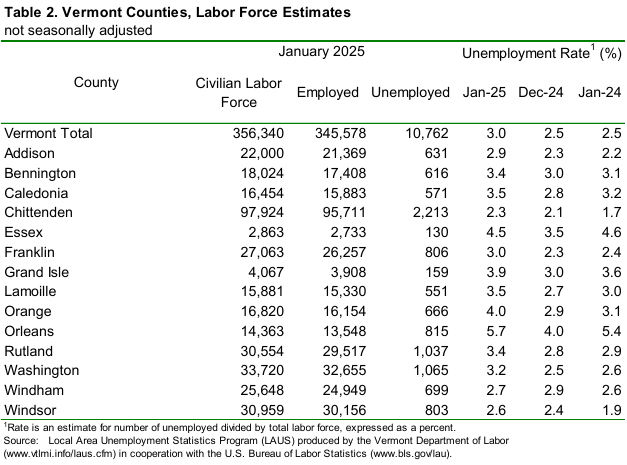
The January unemployment rates for Vermont’s 14 counties ranged from 2.3 percent in Chittenden County to 5.7 percent in Orleans County (note: county unemployment rates are not seasonally-adjusted – see Table 2). For comparison, the January unadjusted unemployment rate for Vermont was 3.0 percent, an increase of five-tenths of one percentage point from the revised unadjusted December level and an increase of five-tenths of one percentage point from a year ago.
Seasonally Adjusted (Table 3)
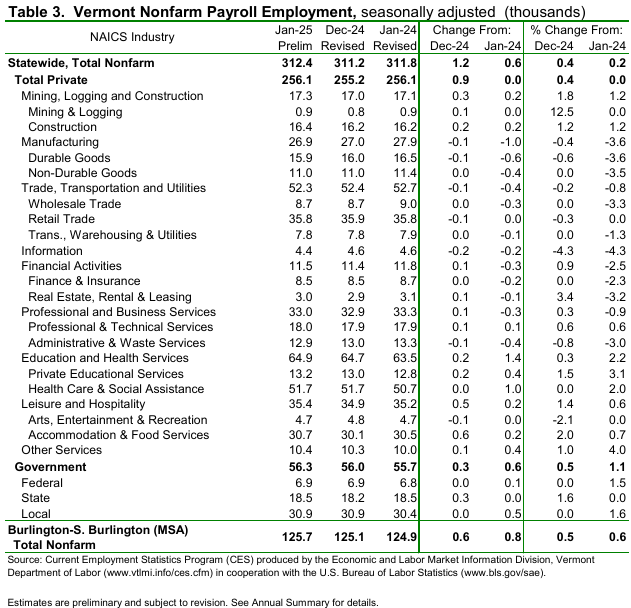
The seasonally adjusted data for January reported an increase of 1,200 jobs from the revised December data. There was a decrease of 3,200 jobs between the preliminary and the revised December estimates due to the inclusion of more data. The seasonally adjusted over-the-month changes in January varied at the industry level. The industries with a notable increase were: Accommodation & Food Services (+600 jobs or +2.0%), State Government (+300 jobs or +1.6%), and Private Educational Services (+200 jobs or +1.5%). The industry with a notable decrease was Information (-200 jobs or -4.3%).
Not-Seasonally-Adjusted (Table 4)
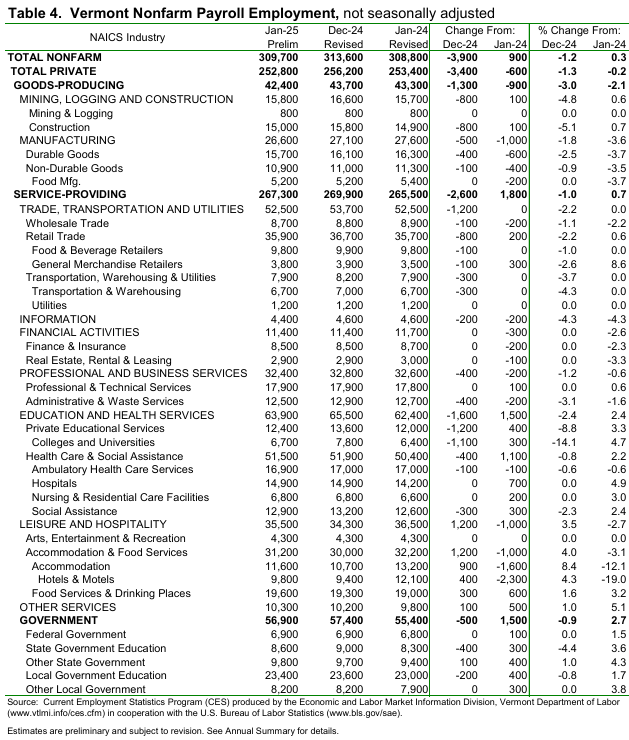
Not-Seasonally-Adjusted (Table 4) The preliminary ‘not-seasonally-adjusted’ jobs estimates for January showed a decrease of 3,900 jobs when compared to the revised December numbers. As with the seasonally adjusted data, this over-the-month change is from the revised December numbers which experienced a decrease of 4,200 jobs from the preliminary estimates. The broader economic picture can be seen by focusing on the over-the-year changes in this data series. As detailed in the preliminary not seasonally adjusted January data, Total Private industries decreased by 600 jobs (-0.2%) over the year and Government (including public education) employment increased by 1,500 jobs (+2.7%) in the past year.
Weekly UI Claims
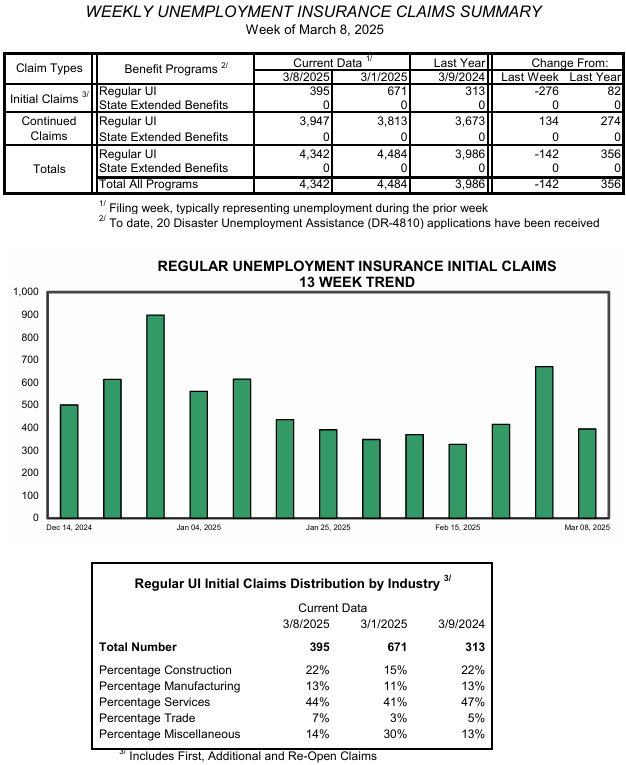
Vermont weekly unemployment claims fell for the week ending March 8, 2025, to under 400 after a spike carried them over 600 the previous week. New claims were 395, down 276 claims from the week before and are 82 more from last year. Claims, which tend to be lowest in the summer, were 181 at the end of September 2024.
CNBC is reporting that nonfarm payrolls increased by a seasonally adjusted 151,000 for February, better than the downwardly revised 125,000 in January but less than the 170,000 consensus forecast.
In the week ending March 8, according to the US DOL, the advance figure for seasonally adjusted initial UI claims was 220,000, a decrease of 2,000 from the previous week's revised level. The previous week's level was revised up by 1,000 from 221,000 to 222,000. The 4-week moving average was 226,000, an increase of 1,500 from the previous week's revised average. The previous week's average was revised up by 250 from 224,250 to 224,500.
In Vermont for the weekly report, the Service industry accounted for the most claims last week with 44%, up 3 points. Construction was at 22%, up 7 points. Manufacturing accounted for 13% of claims, up 2 points.
See more tables below.
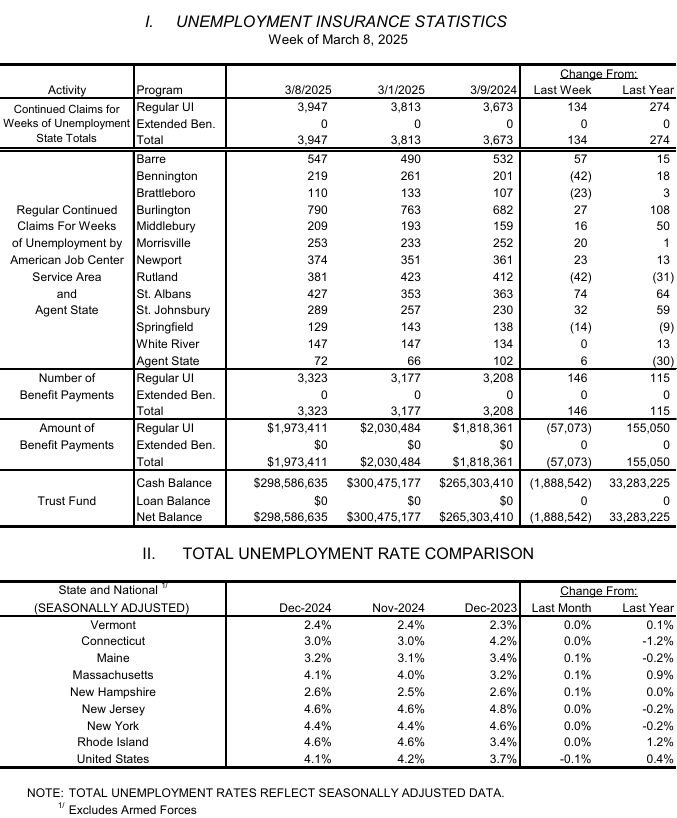
For the week, Vermont total unemployment insurance claims were 4,342 for the week (down 142 for the week and up 356 from this time last year).
Meanwhile the Vermont Unemployment Trust Fund is well capitalized. As of the most recent data, there was $298.6 million in the Trust Fund, down about $1.9 million (as claims are paid out on one side, employers are contributing to the fund on the other). The pre-pandemic Trust Fund balance on March 1, 2020, was $506.2 million.
The Vermont Unemployment and Jobs Report for February is scheduled to be released on Friday, March 28, 2025, at 10:00 a.m.
| State | January 2025(p) rate |
Rank |
|---|---|---|
|
South Dakota |
1.9 | 1 |
|
North Dakota |
2.6 | 2 |
|
Vermont |
2.6 | 2 |
|
Montana |
2.8 | 4 |
|
Nebraska |
2.9 | 5 |
|
New Hampshire |
2.9 | 5 |
|
Hawaii |
3.0 | 7 |
|
Maryland |
3.0 | 7 |
|
Minnesota |
3.0 | 7 |
|
Virginia |
3.0 | 7 |
|
Utah |
3.2 | 11 |
|
Wisconsin |
3.2 | 11 |
|
Alabama |
3.3 | 13 |
|
Connecticut |
3.3 | 13 |
|
Iowa |
3.3 | 13 |
|
Oklahoma |
3.3 | 13 |
|
Florida |
3.5 | 17 |
|
Maine |
3.5 | 17 |
|
Arkansas |
3.6 | 19 |
|
Delaware |
3.6 | 19 |
|
Georgia |
3.6 | 19 |
|
Mississippi |
3.6 | 19 |
|
Wyoming |
3.6 | 19 |
|
Missouri |
3.7 | 24 |
|
North Carolina |
3.7 | 24 |
|
Tennessee |
3.7 | 24 |
|
Idaho |
3.8 | 27 |
|
Kansas |
3.8 | 27 |
|
Pennsylvania |
3.8 | 27 |
|
Arizona |
3.9 | 30 |
|
West Virginia |
4.0 | 31 |
|
Texas |
4.1 | 32 |
|
Massachusetts |
4.2 | 33 |
|
South Carolina |
4.3 | 34 |
|
Washington |
4.3 | 34 |
|
Indiana |
4.4 | 36 |
|
New Mexico |
4.4 | 36 |
|
New York |
4.4 | 36 |
|
Oregon |
4.4 | 36 |
|
Louisiana |
4.5 | 40 |
|
New Jersey |
4.6 | 41 |
|
Ohio |
4.6 | 41 |
|
Rhode Island |
4.6 | 41 |
|
Alaska |
4.7 | 44 |
|
Colorado |
4.7 | 44 |
|
Illinois |
4.9 | 46 |
|
District of Columbia |
5.3 | 47 |
|
Kentucky |
5.3 | 47 |
|
Michigan |
5.3 | 47 |
|
California |
5.4 | 50 |
|
Nevada |
5.8 | 51 |
|
Footnotes |
||
|
Note: Rates shown are a percentage of the labor force. Data refer to place of residence. Estimates for the current month are subject to revision the following month. |
||
Last Modified Date: March 17, 2025
Source: 3.17.2025. Vermont Department of Laborvtlmi.info.
To support vital journalism, access our archives and get unique features like our award-winning profiles, Book of Lists & Business-to-Business Directory, subscribe HERE!
