GasBuddy chart. 9/19/2024
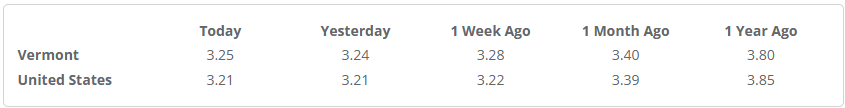
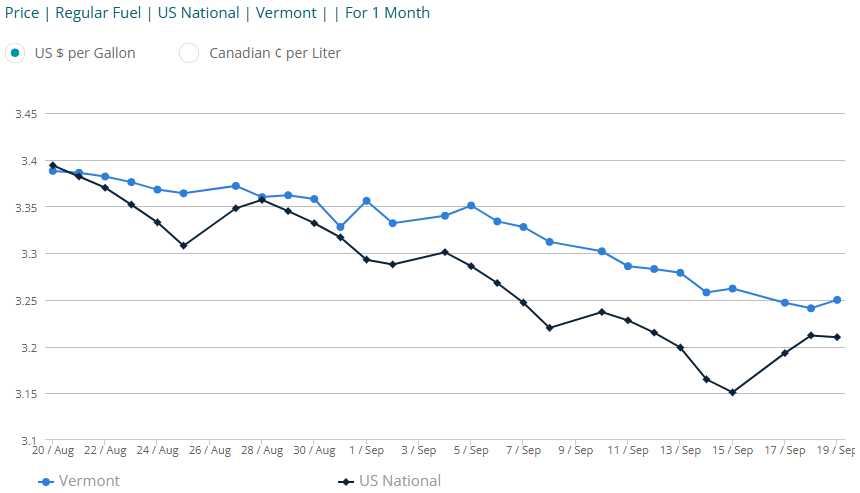
Vermont Business Magazine Average gasoline prices in Vermont are $3.25 per gallon, down 3 cents per gallon from last week, down 5 cents/g from last month and down 55 cents/g from one year ago. The lowest price in the state this week was $2.79/g while the highest was $3.89/g, a difference of $1.10/g.
Average gasoline prices in Burlington have fallen 8.0 cents per gallon in the last week, averaging $3.30/g today, according to GasBuddy's survey of 100 stations in Burlington. Prices in Burlington are 13.7 cents per gallon lower than a month ago and stand 53.7 cents per gallon lower than a year ago.
According to GasBuddy price reports, the cheapest station in Burlington was priced at $3.17/g yesterday while the most expensive was $3.42/g, a difference of 25.0 cents per gallon.
The national average price of gasoline has fallen 1 cent per gallon in the last week, averaging $3.21/g today. The national average is down 18 cents per gallon from a month ago and stands 64 cents per gallon lower than a year ago, according to GasBuddy data compiled from more than 11 million weekly price reports covering over 150,000 gas stations across the country.
The national average price of diesel has declined 3.4 cents in the last week and stands at $3.57 per gallon- the lowest level since January, 2022, over 900 days ago.
Historical gasoline prices in Burlington and the national average going back ten years:
September 16, 2023: $3.84/g (U.S. Average: $3.85/g)
September 16, 2022: $3.87/g (U.S. Average: $3.67/g)
September 16, 2021: $3.17/g (U.S. Average: $3.18/g)
September 16, 2020: $2.17/g (U.S. Average: $2.17/g)
September 16, 2019: $2.74/g (U.S. Average: $2.58/g)
September 16, 2018: $2.93/g (U.S. Average: $2.84/g)
September 16, 2017: $2.76/g (U.S. Average: $2.61/g)
September 16, 2016: $2.22/g (U.S. Average: $2.19/g)
September 16, 2015: $2.36/g (U.S. Average: $2.30/g)
September 16, 2014: $3.58/g (U.S. Average: $3.37/g)
Neighboring areas and their current gas prices:
Albany- $3.30/g, down 6.6 cents per gallon from last week's $3.37/g.
New Hampshire- $3.12/g, down 8.0 cents per gallon from last week's $3.20/g.
"Gasoline prices continue to crumble across nearly the entire nation, with average prices below $3 per gallon in 18 states, with some 65,000 stations selling below that psychological mark. Diesel prices are also falling and are at their lowest level in nearly 1,000 days," said Patrick De Haan, head of petroleum analysis at GasBuddy. "With the change to winter gasoline happening today at most stations across the country, the outlook is bright for the national average to continue to make a run at falling to $2.99 per gallon for the first time since 2021. But while nearly all states are seeing prices drop, refinery maintenance and some outages at California refineries have led to tight supply and rising prices—a situation I hope can be remedied by the end of the month and help California join in on the decline."

Source: GasBuddy
GasBuddy is the authoritative voice for gas prices and the only source for station-level data. GasBuddy's survey updates 288 times every day from the most diverse list of sources covering nearly 150,000 stations nationwide, the most comprehensive and up-to-date in the country. GasBuddy's averages, graphs, maps and historical pricing data covering the U.S. and Canada is available 24/7 at http://prices.GasBuddy.com.
OIL MARKETS
After declining for several weeks, oil markets finally saw a reversal last week with gains across the board, however, plenty of volatility is expected in the weeks ahead as OPEC continues to mull over the timing of restoring oil production. In early Monday trade, a barrel of WTI crude oil was up 87 cents to $69.52 per barrel, slightly above last week’s $68.40 start. Brent crude oil was also trading higher in early trade, up 75 cents to $72.36, a slight increase from last week’s $71.72 per barrel start. With Hurricane Francine now clear of the Gulf, restoration efforts have begun to start re-opening platforms in the Gulf of Mexico, a process that may take time as crews return to normal operations. Economic weakness has also remained as one of the bearish factors holding oil prices down.
OIL AND REFINED PRODUCTS
Last week’s report from the EIA showed an 800,000 barrel rise in crude oil inventories, which are about 4% below the five-year average for this time of year. Gasoline inventories picked up 2.3 million barrels while distillate inventories also rose by 2.3 million barrels. Refineries operated at 92.8% of their capacity, producing 9.4 million barrels of gasoline per day and 5.2 million barrels of distillates. Implied gasoline demand fell by 460,000 barrels to 8.48 million barrels per day.
FUEL DEMAND
According to GasBuddy demand data driven by its Pay with GasBuddy™ fuel card, U.S. retail gasoline demand saw a rise of 0.2% for the week ending September 14 (Sun-Sat). Broken down by PADD region, demand rose 0.4% in PADD 1, rose 0.4% in PADD 2, rose 2.3% in PADD 3, fell 4.6% in PADD 4, and fell 2.9% in PADD 5. GasBuddy models U.S. gasoline demand at 8.83 million barrels per day.
GAS PRICE TRENDS
The most common U.S. gas price encountered by motorists stood at $2.99 per gallon, unchanged cents from last week, followed by $3.09, $2.89, $3.19, and $2.79 rounding out the top five most common prices.
The median U.S. gas price is $3.01 per gallon, down 8 cents from last week and about 14 cents lower than the national average.
The top 10% of stations in the country average $4.46 per gallon, while the bottom 10% average $2.53 per gallon.
The states with the lowest average prices: Texas ($2.68), Tennessee ($2.69), Mississippi ($2.69).
The states with the highest average prices: California ($4.68), Hawaii ($4.58), and Washington ($4.07).
Biggest weekly changes: Indiana (-15.6¢), Ohio (-13.7¢), Texas (-11.9¢), South Carolina (-11.5¢), Illinois (-10.9¢)
DIESEL PRICE TRENDS
The most common U.S. diesel price stood at $3.49 per gallon, unchanged from last week, followed by $3.59, $3.39, $3.69, and $3.29 rounding out the top five most common prices.
The median U.S. diesel price is $3.49 per gallon, unchanged from last week and about 8 cents lower than the national average for diesel.
Diesel prices at the top 10% of stations in the country average $4.49 per gallon, while the bottom 10% average $2.89 per gallon.
The states with the lowest average diesel prices: Texas ($3.03), Oklahoma ($3.12), and Mississippi ($3.20).
The states with the highest average diesel prices: Hawaii ($5.33), California ($4.88), and Washington ($4.35).
Biggest weekly changes: South Dakota (-9.9¢), Texas (-9.9¢), Vermont (-9.8¢), Maryland (-8.9¢), Illinois (-8.5¢).
EIA Report
The Energy Information Administration (EIA) released its weekly report today on the status of petroleum inventories in the United States. Here are some highlights:
CRUDE OIL INVENTORIES:
Crude oil inventories decreased by 1.6 million barrels (MMbbl) to a total of 417.5 MMbbl. At 417.5 MMbbl, inventories are 0.9 MMbbl above last year (-0.2%) and are 4% below the five-year average for this time of year. Inventories in Cushing, OK, the NYMEX delivery point, fell 2.0 million barrels to a total of 22.7 million barrels. The Strategic Petroleum Reserve (SPR) rose 0.7 million barrels from the prior week and stands at 380.6 million barrels, 8.4% above the year-ago level.
Domestic crude oil production fell 100,000bpd to 13.2 million barrels per day, 300,000 bpd higher than the year-ago period. Alaska oil production rose 57,000bpd to 411,000 bpd, while production in the Lower 48 fell 100,000bpd to 12.8 million barrels per day.
GASOLINE INVENTORIES:
Gasoline inventories increased by 0.1 million barrels (MMbbl) to a total of 221.6 MMbbl. At 221.6 MMbbl, inventories are up 2.1 MMbbl, or 1.0% higher than a year ago, and are about 0% below the five-year average for this time of year.
Here’s how individual regions and their gasoline inventory fared:
East Coast (-2.6 MMbbl)
Midwest (-0.5 MMbbl)
Gulf Coast (+4.3 MMbbl)
Rockies (-0.1 MMbbl)
West Coast (-1.1 MMbbl)
It’s important to note which regions saw increases/decreases as this information likely drives prices up (in the case of falling inventories) or down (in the case of rising inventories).
Oil Inventories Slip, Refinery Runs Slow Down as Maintenance Ramps Up Distillate inventories increased by 0.1 million barrels to a total of 125.1 MMbbl. At 125.1 MMbbl, inventories are up 5.5 MMbbl, or 4.6% higher than a year ago. Distillate inventories stand about 9% below the five-year average for this time of year.
IMPLIED GASOLINE DEMAND:
Gasoline supplied to the market amounted to 8.78 million barrels per day (MMbpd), or 298,000 bpd higher than the previous week. So far in 2024, implied gasoline demand (“products supplied”) is 0.4% lower versus 2023, per the EIA.
REFINERY OUTPUT/UTILIZATION:
Refinery utilization decreased by 0.7 percentage points versus last week’s numbers to reach 92.1%. Gasoline production increased to 9.7 million barrels per day while distillate fuel production decreased to 5.1 million barrels per day last week.
Utilization rates for the last week were as follows:
East Coast: 87.0% (+0.8%)
Midwest: 94.9% (-0.5%)
Gulf Coast: 92.1% (-1.0%)
Rocky Mountains: 89.5% (-8.3%)
West Coast: 90.0% (+1.4%)
These percentages show how much of a region’s overall capacity was used to refine oil. It’s important to note these percentages because the lower the utilization percentage, the lower the output, which has a direct impact on local gasoline prices. If refiners in your region have lower or falling utilization rates, you’re more likely to see gas prices rise.
OVERALL SUPPLY:
Total oil stocks in the United States (excluding the SPR) are up by 14.0 MMbbl (+1.1%) versus a year ago and stand at 1.283 billion barrels (excluding the Strategic Petroleum Reserve). Including the SPR, total stocks are up 43.4 million barrels (+2.7%) versus a year ago.
IMPORTS/EXPORTS:
The U.S. imported 6.32 MMbpd of crude oil per day last week, down 545,000 bpd versus the previous week, while crude oil exports rose by 1,284,000 bpd to 4.59 MMbpd. Total motor gasoline imports last week averaged 467,000 bpd. The U.S. also imported 138,000 bpd of distillate fuels. However, during the same timeframe, the U.S. exported 737,000 bpd of finished gasoline and 1,378,000 bpd of distillates. In total, U.S. companies exported 11.25 MMbpd of oil and petroleum products.
Before the report was released, the price of West Texas Intermediate crude oil was down 11 cents to $71.08 per barrel. Soon after the report was released, oil was down 8 cents per barrel.
To support vital journalism, access our archives and get unique features like our award-winning profiles, Book of Lists & Business-to-Business Directory, subscribe HERE!
