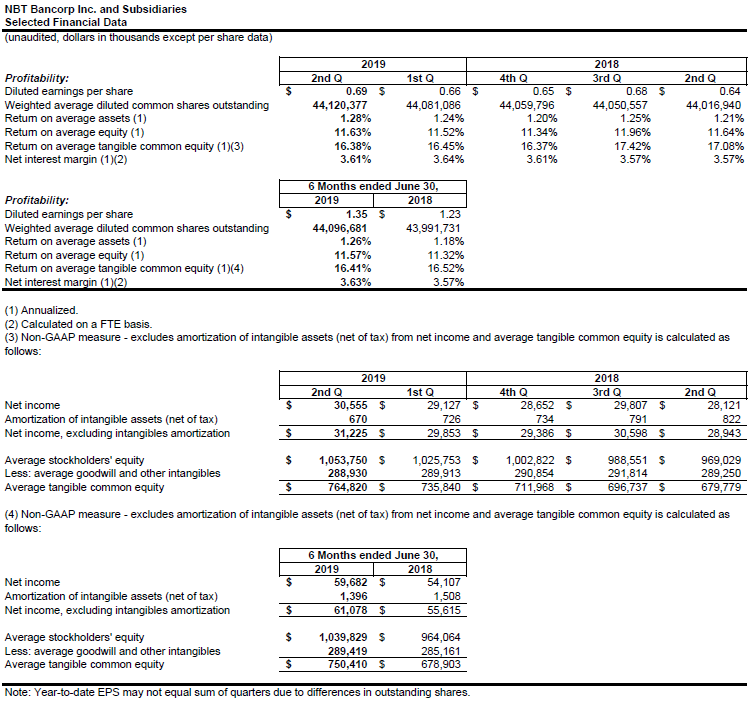
Vermont Business Magazine NBT Bancorp Inc (NASDAQ: NBTB), the upstate-New York based parent of NBT Bank with branches in Northwest Vermont, reported on Monday net income and diluted earnings per share for both the three and six months ended June 30, 2019. Net income for the three months ended June 30, 2019 was $30.6 million, up 4.9% from $29.1 million for the first quarter of 2019 and up 8.7% from $28.1 million for the second quarter of 2018. Diluted earnings per share for the three months ended June 30, 2019 was $0.69, as compared with $0.66 for the prior quarter, an increase of 4.5%, and $0.64 for the second quarter of 2018, an increase of 7.8%.
Net income for the six months ended June 30, 2019 was $59.7 million, up 10.3% from $54.1 million for the same period last year. Diluted earnings per share for the six months ended June 30, 2019 was $1.35, as compared with $1.23 for the same period in 2018, an increase of 9.8%.
Shares of NBT were down slightly Tuesday morning ($37.06 -0.09,-0.24%; 52-week range $30.36 - $41.88).
Highlights:
- Quarterly diluted earnings per share up 4.5% from prior quarter and up 7.8% from prior year
- Quarter-to-date net income up 4.9% from prior quarter and up 8.7% from prior year
- FTE net interest margin of 3.63% for the six months ended June 30, 2019, up 6 bps from 2018
- Full cycle deposit beta of 14.7% through the quarter ending June 30, 2019 [1]
- Tangible equity ratio of 8.41%, up 93 bps from the second quarter of 2018
"For the first six months of 2019, we achieved double-digit year-over-year growth with earnings per share and net income up 10% over the same period in 2018,” said NBT President and CEO John H. Watt, Jr. “Positive trends in net interest income and tangible capital growth demonstrate we are effectively managing our business and growing earnings while investing in our long-term strategies. Our team remains focused on building shareholder value by delivering a great customer experience. Relentless focus on process improvement and digitization will permit reinvestment of the productivity gains created into the customer experience.”
Net interest income was $78.6 million for the second quarter of 2019, up $0.9 million, or 1.2%, from the previous quarter. The fully taxable equivalent (“FTE”) net interest margin was 3.61% for the three months ended June 30, 2019, down 3 basis points (“bps”) from the previous quarter, as higher funding costs on average interest-bearing liabilities were partially offset by higher average interest-earning assets. Interest income increased $1.9 million, or 2.1%, as the yield on average interest-earning assets of 4.28% was comparable to the prior quarter, while average interest-earning assets of $8.8 billion increased $70 million compared with the prior quarter. Interest expense was up $1.0 million, or 7.0%, as the cost of interest-bearing liabilities increased 4 bps to 0.96% for the quarter ended June 30, 2019, driven by interest-bearing deposit costs increasing 8 bps, partially offset by the 6 bp decrease in short-term borrowings cost.
Net interest income was $78.6 million for the second quarter of 2019, up $2.9 million, or 3.8%, from the second quarter of 2018. The FTE net interest margin of 3.61% was up 4 bps from the second quarter of 2018. Interest income increased $8.5 million, or 10.0%, as the yield on average interest-earning assets increased 29 bps from the same period in 2018, and average interest-earning assets increased $209.7 million, or 2.4%, primarily due to a $207.6 million increase in average loans. Interest expense increased $5.6 million, as the cost of interest-bearing liabilities increased 35 bps, driven by interest-bearing deposit costs increasing 38 bps combined with a 39 bp increase in short-term borrowing costs.
Net interest income for the first six months of 2019 was $156.3 million, up $7.1 million, or 4.8%, from the same period in 2018. FTE net interest margin of 3.63% for the six months ended June 30, 2019, was up from 3.57% for the same period in 2018. Average interest-earning assets were up $261.6 million, or 3.1% for the six months ended June 30, 2019, as compared to the same period in 2018, driven by a $250.7 million increase in loans. Interest income increased $19.1 million, or 11.5%, due to the increase in earning assets combined with a 30 bp improvement in loan yields. Interest expense was up $12.0 million, for the six months ended June 30, 2019 as compared to the same period in 2018 as the cost of interest-bearing liabilities increased 38 bps, driven by interest-bearing deposit costs increasing 38 bps combined with a 55 bp increase in short-term borrowing costs. The Federal Reserve has raised its target fed funds rate nine times from December 2015 through June 2019 for a total increase of 225 bps. During this same cycle of increasing rates, the Company’s average cost of deposits increased by 33 bps, resulting in a full cycle deposit beta of 14.7%.
Noninterest income for the three months ended June 30, 2019 was $34.2 million, up $0.4 million, or 1.2%, from the prior quarter and comparable with the second quarter of 2018. The increase from the prior quarter was primarily driven by higher ATM and debit card fees due to an increase in the number of accounts and usage and other noninterest income due to higher swap fee income that was partially offset by lower seasonal insurance and other financial services revenue.
Noninterest income for the six months ended June 30, 2019 was $68.1 million, up $2.6 million, or 4.0%, from the same period in 2018. The increase from the prior year was driven by higher retirement plan administration fees due to the acquisition of Retirement Plan Services, LLC “RPS” in the second quarter of 2018 and higher ATM and debit card fees due to an increase in the number of accounts and usage that was partially offset by lower trust income and other noninterest income due to lower non-recurring gains recognized in the first six months of 2019.
Noninterest expense for the three months ended June 30, 2019 was $66.2 million, down $2.2 million, or 3.3%, from the prior quarter and up $1.3 million, or 2.1%, from the second quarter of 2018. The decrease from the prior quarter was primarily driven by lower seasonal occupancy expenses and timing of equity-based compensation and other noninterest expense items. The increase from the second quarter of 2018 was driven by increases in salaries and employee benefits expense and equipment expense. Salaries and employee benefits expense increased from the second quarter of 2018 due to wage increases and higher incentive compensation.
Noninterest expense for the six months ended June 30, 2019 was $134.7 million, up $5.5 million, or 4.3%, from the same period in 2018. The increase from the prior year was driven by higher salaries and employee benefits, equipment expense and other noninterest expenses in the first half of 2019 as compared to the same period of 2018. The increase in salaries and employee benefits was primarily due to the RPS acquisition in the second quarter of 2018 and the timing of incentive compensation and wage increases.
Income tax expense for the three months ended June 30, 2019 was $8.8 million, up $0.7 million from the prior quarter and up $0.7 million from the second quarter of 2018. The effective tax rate of 22.4% for the second quarter of 2019 was up from 21.8% for the first quarter of 2019 and comparable to the second quarter of 2018. The increase in income tax expense from the prior quarter and from the second quarter of 2018 was primarily due to a higher level of taxable income.
Income tax expense for the six months ended June 30, 2019 was $16.9 million, up $1.8 million, or 11.9%, from the same period of 2018. The effective tax rate of 22.1% for the first six months of 2019 was up from 21.8% for the same period in the prior year. The increase in income tax expense from the prior year was due to a higher level of taxable income.
Asset Quality
Net charge-offs of $6.5 million for the three months ended June 30, 2019 were down as compared to $6.9 million for the prior quarter and comparable to the second quarter of 2018. Provision expense was higher at $7.3 million for the three months ended June 30, 2019, as compared with $5.8 million for the prior quarter and down from $8.8 million for the second quarter of 2018. Annualized net charge-offs to average loans for the second quarter of 2019 was 0.38%, down from 0.41% for the prior quarter and down from 0.39% for the second quarter of 2018.
Net charge-offs of $13.4 million for the six months ended June 30, 2019 compared to $13.3 million for the same period of 2018. Provision expense was $13.1 million for the six months ended June 30, 2019, as compared with $16.3 million for the same period of 2018. Annualized net charge-offs to average loans for the first six months of 2019 was 0.39% as compared with 0.40% for the first six months of 2018.
Nonperforming loans to total loans was 0.39% at June 30, 2019, down 3 bps from 0.42% at March 31, 2019 and up 1 bp from 0.38% at June 30, 2018. Past due loans as a percentage of total loans were 0.52% at June 30, 2019, comparable to March 31, 2019 and up from 0.50% at June 30, 2018.
The allowance for loan losses totaled $72.2 million at June 30, 2019, compared to $71.4 million at March 31, 2019 and $72.5 million at June 30, 2018. The allowance for loan losses as a percentage of loans was 1.04% (1.08% excluding acquired loans) at June 30, 2019, compared to 1.04% (1.09% excluding acquired loans) at March 31, 2019 and 1.06% (1.11% excluding acquired loans) at June 30, 2018.
Balance Sheet
Total assets were $9.6 billion at June 30, 2019, comparable to December 31, 2018. Loans were $7.0 billion at June 30, 2019, up $75.6 million from December 31, 2018. In the first half of 2019, loan growth in commercial and commercial real estate was partially offset by run-off in our consumer portfolios. Total deposits were $7.6 billion at June 30, 2019, up $225.5 million, or 3.1%, from December 31, 2018, reflecting growth in core and municipal deposits. Stockholders’ equity was $1.1 billion, representing a total equity-to-total assets ratio of 11.15% at June 30, 2019, compared with $1.0 billion or a total equity-to-total assets ratio of 10.65% at December 31, 2018.
Corporate Overview
NBT Bancorp Inc. is a financial holding company headquartered in Norwich, N.Y., with total assets of $9.6 billion at June 30, 2019. The company primarily operates through NBT Bank, NA, a full-service community bank and through two financial services companies. NBT Bank, N.A. has 149 banking locations in New York, Pennsylvania, Vermont, Massachusetts, New Hampshire and Maine. EPIC Retirement Plan Services, based in Rochester, N.Y., is a full-service 401(k) plan recordkeeping firm. NBT Insurance Agency, LLC, based in Norwich, N.Y., is a full-service insurance agency. More information about NBT and its divisions is available online at: www.nbtbancorp.com, www.nbtbank.com, www.epic1st.com and www.nbtinsurance.com.
[1] The change in the Company’s quarterly deposit costs from December 31, 2015 to June 30, 2019 of 0.33% divided by the change in Federal Reserve’s target fed funds rate from December 2015 to June 2019 of 2.25%
Source: NORWICH, NY (July 22, 2019) – NBT Bancorp Inc