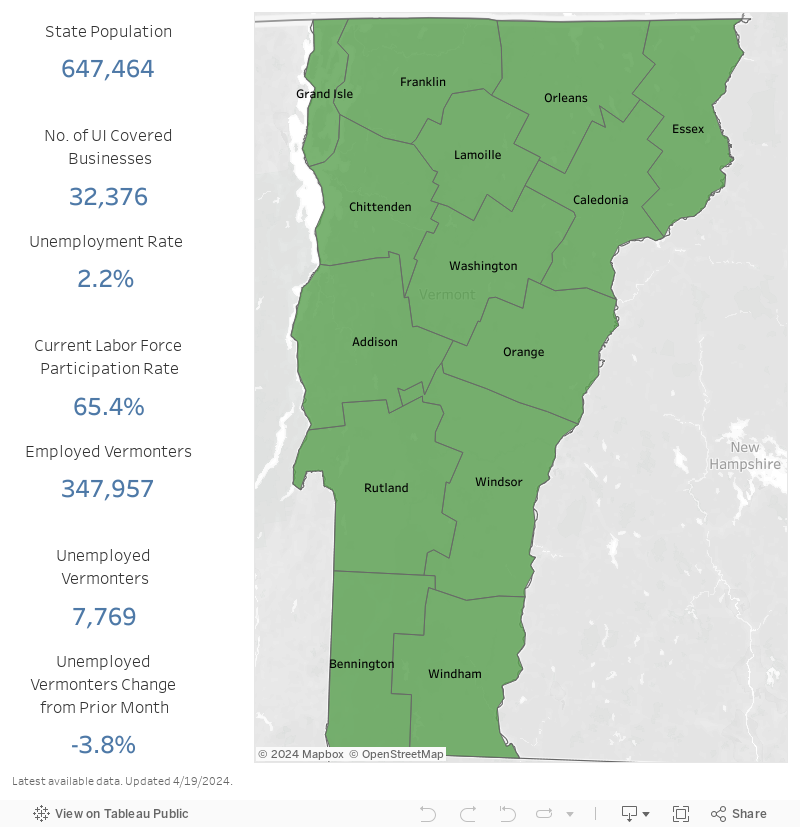
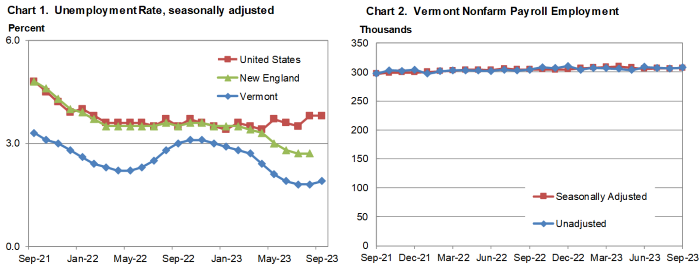
by Timothy McQuiston, Vermont Business Magazine VermontBiz.com Vermont's unemployment rate rose one-tenth to 1.9% in September, as the number of unemployed edged up. The Vermont Department of Labor released the seasonally adjusted data today. Vermont still has the second lowest rate in the nation. Maryland is lowest at 1.6% and Nevada is highest at 5.4%. The comparable United States rate in September was 3.8 percent, no change from the revised August estimate.
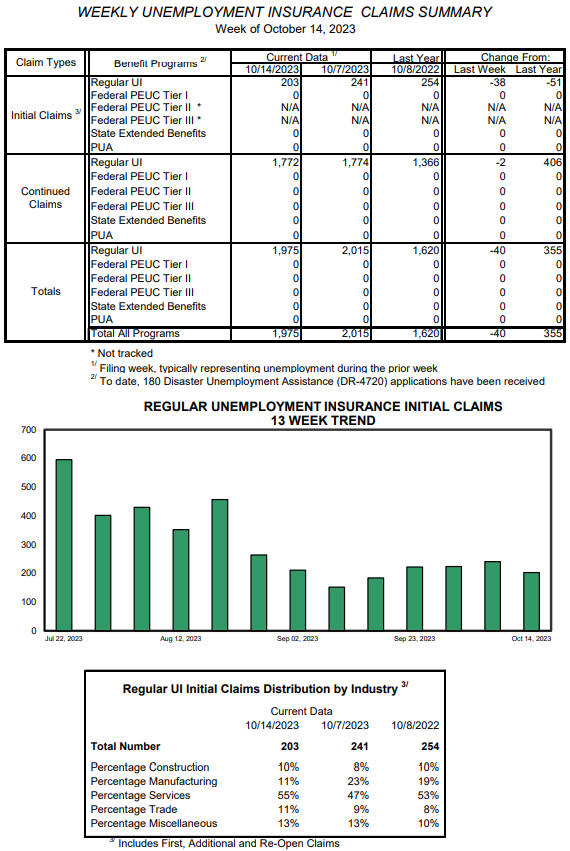
The civilian labor force participation rate was 64.1 percent in September, an increase of one-tenth of one percentage point from the prior month’s revised estimate. Weekly unemployment claims for the week of October 14 were a low 203 in Vermont, down 38 for the week and down 51 from the same time last year. There was a small spike in claims over the summer following the July and August rain storms.
For the US, seasonally adjusted initial claims were 198,000, a decrease of 13,000 from the previous week's revised level. The 4-week moving average was 205,750, a decrease of 1,000 from the previous week's revised average. The Federal Reserve has indicated that the economy is still growing too fast, which could trigger further rate hikes. The stock market has declined this week as interest rates climb and with the possible hikes by the Fed.
See tables below.
Labor Commissioner Michael Harrington said: “After a summer of statistical volatility, the monthly numbers in September present greater stability, with many estimates showing minor changes. Overall, tight labor market conditions persist for many businesses in Vermont. Throughout October, the Department celebrates National Manufacturing Month and the numerous rewarding careers available, along with apprenticeships and on-the-job training opportunities. Manufacturers are some of Vermont’s most significant employers, offering diverse career paths from production to design. Manufacturing is a vital industry with a history of economic advancement. If you want to learn more about Manufacturing Month, you can visit the Department’s website https://labor.vermont.gov/vermont-manu.
"Additionally, the Department of Labor will be celebrating the 9th Annual National Apprenticeship Week November 13th-19th. Registered Apprenticeships are an industry-driven, high-quality career pathway that allows individuals the ability to earn a nationally recognized credential through paid work experience and classroom instruction. For more information on Vermont’s Registered Apprenticeship Program, visit https://labor.vermont.gov/workforce-development/apprenticeship.”
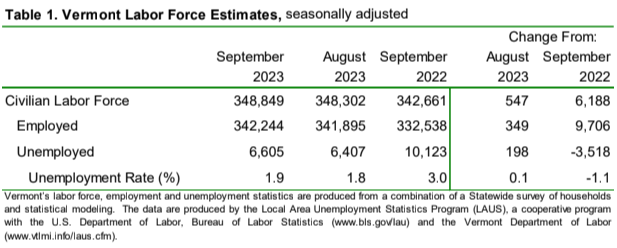
The seasonally adjusted Vermont data for September show the Vermont civilian labor force increased by 547 from the prior month’s revised estimate (see Table 1). The number of employed persons increased by 349 and the number of unemployed persons increased by 198. No changes were statistically significant in the seasonally-adjusted series.
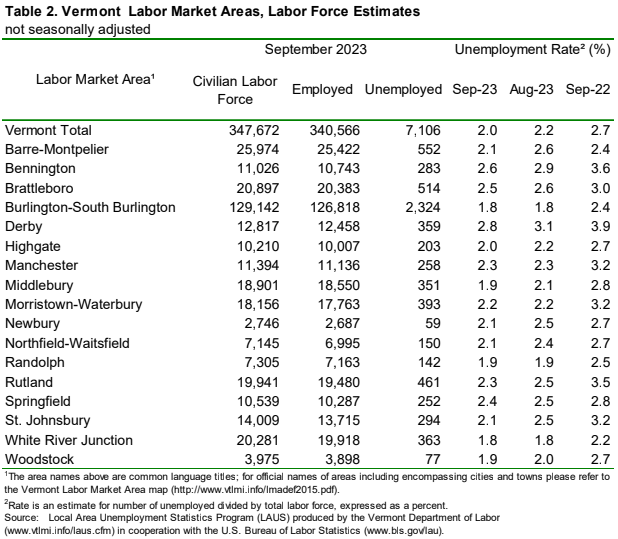
The September unemployment rates for Vermont’s 17 labor market areas ranged from 1.8 percent in Burlington-South Burlington and White River Junction to 2.8 percent in Derby (note: local labor market area unemployment rates are not seasonally-adjusted – see Table 2 above and map below). For comparison, the September unadjusted unemployment rate for Vermont was 2.0 percent, a decrease of two-tenths of one percentage point from the revised unadjusted August level and a decrease of seven-tenths of one percentage point from a year ago.
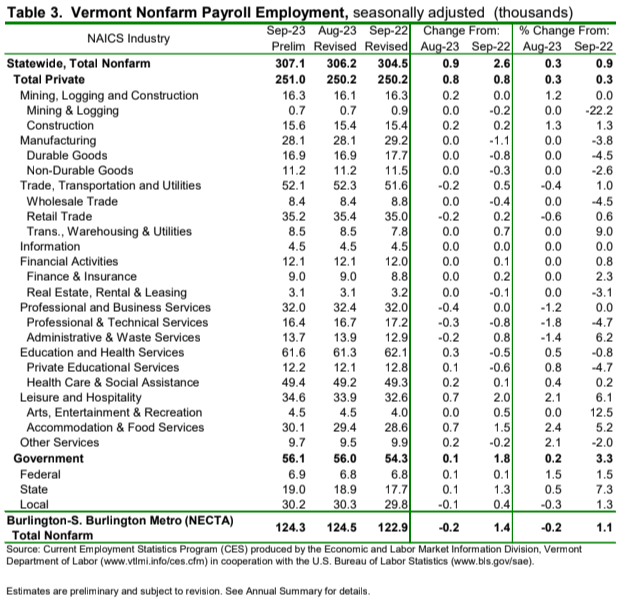
Seasonally-Adjusted (Table 3)
The seasonally adjusted data for September reported an increase of 900 jobs from the revised August data. There was an increase of 200 jobs between the preliminary and the revised August estimates due to the inclusion of more data. The seasonally adjusted over-the-month changes in September were varied at the industry level. Those with a notable increase included: Accommodation & Food Services (+700 jobs or +2.4%) and Other Services (+200 jobs or +2.1%). Industries with a notable decrease included: Professional & Technical Services (-300 jobs or -1.8%) and Administrative & Waste Services (-200 jobs or -1.4%).
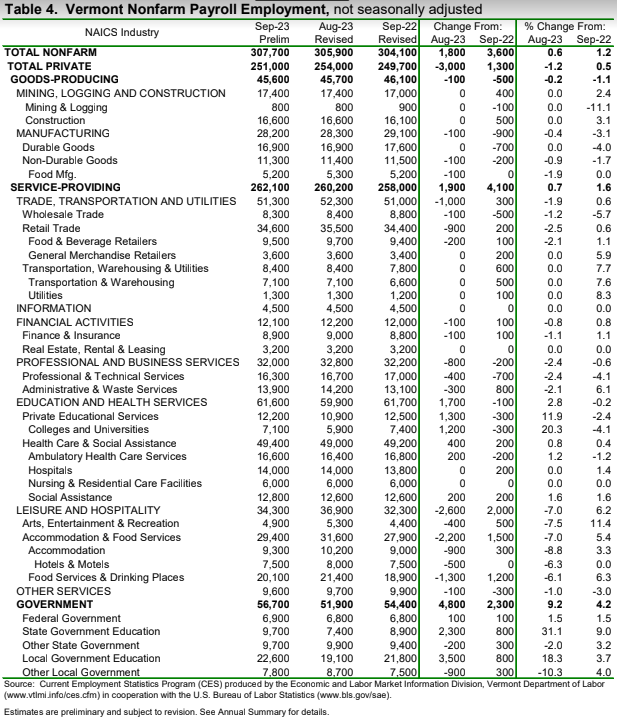
Not-Seasonally-Adjusted (Table 4)
The preliminary ‘not-seasonally-adjusted’ jobs estimates for September showed an increase of 1,800 jobs when compared to the revised August numbers. As with the seasonally adjusted data, this over-the-month change is from the revised August numbers which experienced a decrease of 100 jobs from the preliminary estimates. The broader economic picture can be seen by focusing on the over-the-year changes in this data series. As detailed in the preliminary not-seasonally-adjusted September data, Total Private industries increased by 1,300 jobs (+0.5%) over the year and Government (including public education) employment increased by 2,300 jobs (+4.2%) in the past year.
| State | September 2023(P) rate |
Rank |
|---|---|---|
|
Maryland |
1.6 | 1 |
|
North Dakota |
1.9 | 2 |
|
South Dakota |
1.9 | 2 |
|
Vermont |
1.9 | 2 |
|
New Hampshire |
2.0 | 5 |
|
Nebraska |
2.1 | 6 |
|
Alabama |
2.2 | 7 |
|
Virginia |
2.5 | 8 |
|
Massachusetts |
2.6 | 9 |
|
Rhode Island |
2.6 | 9 |
|
Utah |
2.6 | 9 |
|
Maine |
2.7 | 12 |
|
Montana |
2.7 | 12 |
|
Florida |
2.8 | 14 |
|
Hawaii |
2.8 | 14 |
|
Kansas |
2.8 | 14 |
|
Arkansas |
2.9 | 17 |
|
Missouri |
2.9 | 17 |
|
South Carolina |
2.9 | 17 |
|
Wyoming |
2.9 | 17 |
|
Iowa |
3.0 | 21 |
|
Oklahoma |
3.0 | 21 |
|
Idaho |
3.1 | 23 |
|
Minnesota |
3.1 | 23 |
|
Wisconsin |
3.1 | 23 |
|
Colorado |
3.2 | 26 |
|
Mississippi |
3.2 | 26 |
|
Tennessee |
3.2 | 26 |
|
Louisiana |
3.3 | 29 |
|
Georgia |
3.4 | 30 |
|
North Carolina |
3.4 | 30 |
|
Ohio |
3.4 | 30 |
|
Pennsylvania |
3.4 | 30 |
|
Connecticut |
3.5 | 34 |
|
Oregon |
3.5 | 34 |
|
Indiana |
3.6 | 36 |
|
Washington |
3.6 | 36 |
|
New Mexico |
3.7 | 38 |
|
West Virginia |
3.8 | 39 |
|
Michigan |
3.9 | 40 |
|
Arizona |
4.0 | 41 |
|
New York |
4.0 | 41 |
|
Alaska |
4.1 | 43 |
|
Delaware |
4.1 | 43 |
|
Kentucky |
4.1 | 43 |
|
Texas |
4.1 | 43 |
|
Illinois |
4.4 | 47 |
|
New Jersey |
4.4 | 47 |
|
California |
4.7 | 49 |
|
District of Columbia |
5.0 | 50 |
|
Nevada |
5.4 | 51 |
|
Footnotes |
||
|
Note: Rates shown are a percentage of the labor force. Data refer to place of residence. Estimates for the current month are subject to revision the following month. |
||
Last Modified Date: October 20, 2023