Vermont Business Magazine Today, the Vermont Department of Labor released the seasonally adjusted unemployment rate, which declined to 1.8 percent in July. This reflects a decrease of one-tenth of one percentage point from the prior month’s revised estimate. This is the lowest rate ever recorded in the state. The comparable United States rate in July was 3.5 percent, a decrease of one-tenth of one percentage point from the revised June estimate. This reflects a decrease of one-tenth of one percentage point from the prior month’s revised estimate. The civilian labor force participation rate was 63.9 percent in July, an increase of one-tenth of one percentage point from the prior month’s revised estimate. Vermont is tied for the second lowest rate in the nation. New Hampshire is lowest at a record 1.7%.
See all tables below.

"The Department understands that individuals and businesses have been tremendously impacted by the floods. Please visit the Department’s website to learn about our services or for information on Disaster Unemployment Assistance: https://labor.vermont.gov/dua. Anyone, including self-employed individuals and independent contractors, who has seen their earnings impacted by the flood should file first for traditional unemployment insurance benefits before requesting Disaster Unemployment Assistance.”

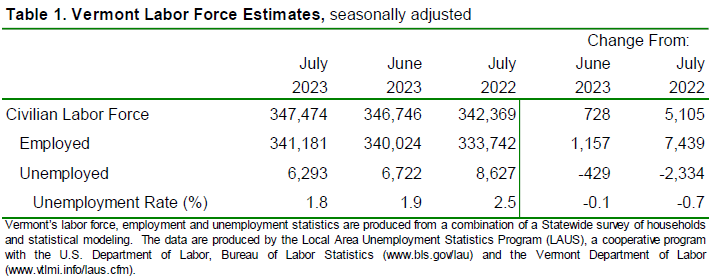
The Vermont seasonally adjusted unemployment rate declined to 1.8 percent in July. The comparable United States rate in July was 3.5 percent, a decrease of one-tenth of one percentage point from the revised June estimate. The seasonally adjusted Vermont data for July show the Vermont civilian labor force increased by 728 from the prior month’s revised estimate (see Table 1). The number of employed persons increased by 1,157 and the number of unemployed persons decreased by 429. The changes to the number of employed persons, the number of unemployed persons and the unemployment rate were statistically significant in the seasonally adjusted series.
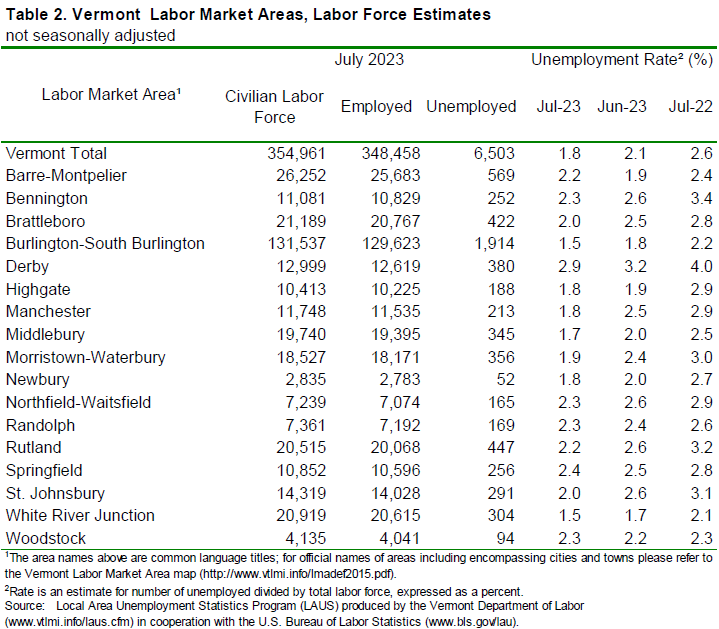
The July unemployment rates for Vermont’s 17 labor market areas ranged from 1.5 percent in Burlington-South Burlington and White River Junction to 2.9 percent in Derby (note: local labor market area unemployment rates are not seasonally-adjusted – see Table 2). For comparison, the July unadjusted unemployment rate for Vermont was 1.8 percent, a decrease of three-tenths of one percentage point from the revised unadjusted June level and a decrease of eight-tenths of one percentage point from a year ago.
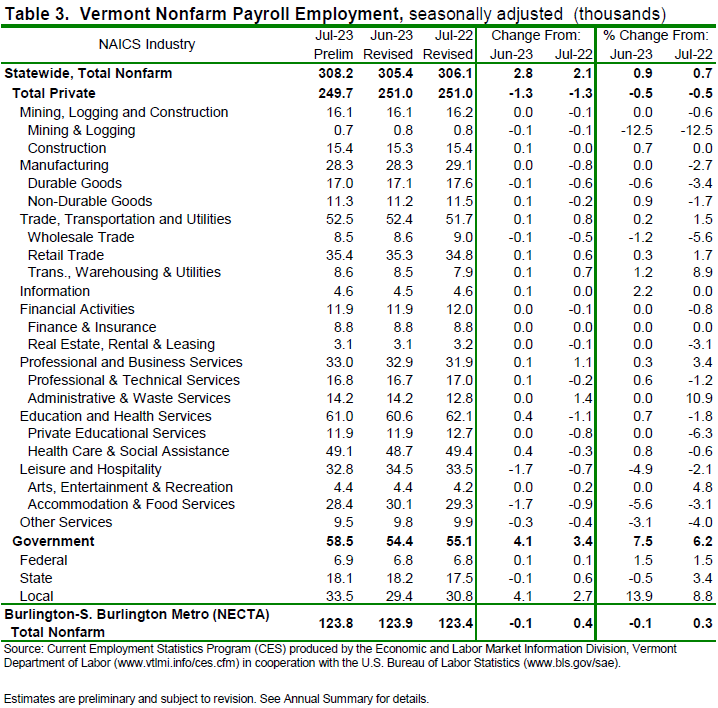
Seasonally-Adjusted (Table 3)
The seasonally-adjusted data for July reported an increase of 2,800 jobs from the revised June data. There was an increase of 2,300 jobs between the preliminary and the revised June estimates due to the inclusion of more data. The seasonally-adjusted over-the-month changes in July were varied at the industry level. Those with a notable increase included: Local Government (+4,100 jobs or +13.9%) and Health Care & Social Assistance (+400 jobs or +0.8%). Industries with a notable decrease included: Accommodation & Food Services (-1,700 jobs or -5.6%) and Other Services (-300 jobs or -3.1%)
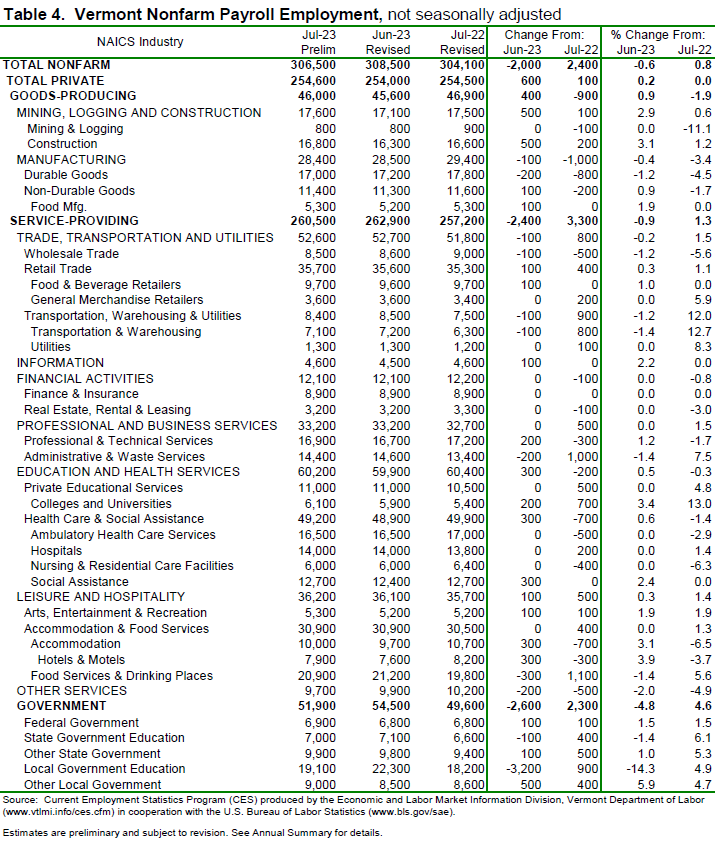
Not-Seasonally-Adjusted (Table 4)
The preliminary ‘not-seasonally-adjusted’ jobs estimates for July showed a decrease of 2,000 jobs when compared to the revised June numbers. As with the seasonally adjusted data, this over-the-month change is from the revised June numbers which experienced an increase of 3,100 jobs from the preliminary estimates. The broader economic picture can be seen by focusing on the over-the-year changes in this data series. As detailed in the preliminary not-seasonally-adjusted July data, Total Private industries increased by 100 jobs (+0.0%) over the year and Government (including public education) employment increased by 2,300 jobs (+4.6%) in the past year.
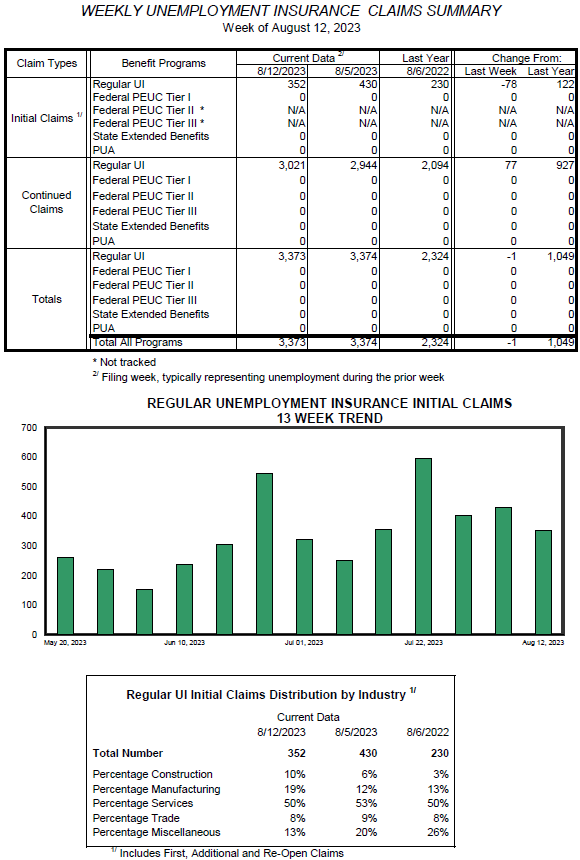
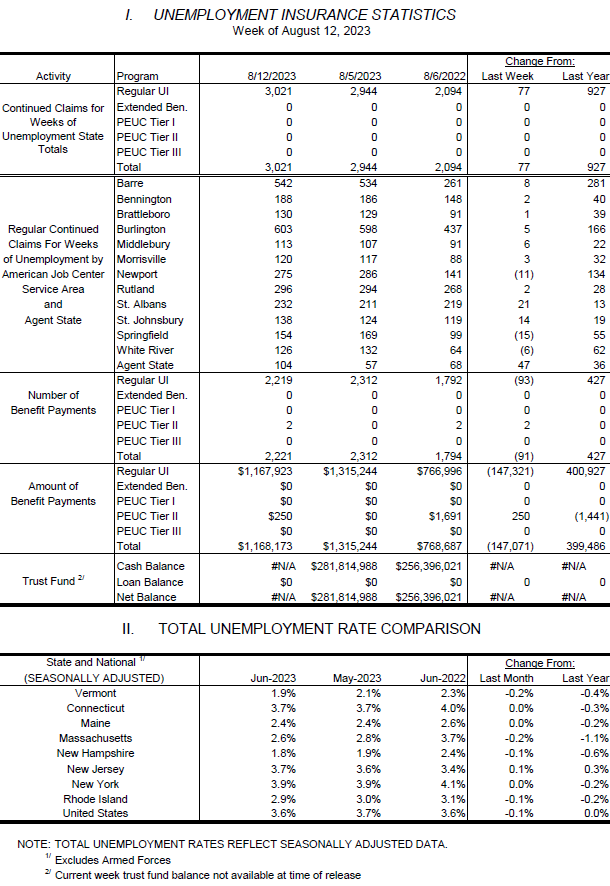
Meanwhile, weekly unemployment claims in Vermont are running slightly higher than usual this summer and there was a spike after the July flood. However, as of the August 12 report, claims were down 78 from the previous week but up 122 from the same period last year.
Nationally, in the week ending August 12, the advance figure for seasonally adjusted initial claims was 239,000, a decrease of 11,000 from the previous week's revised level. However, claims have been edging up year-over-year. The previous week's level was revised up by 2,000 from 248,000 to 250,000. The 4-week moving average was 234,250, an increase of 2,750 from the previous week's revised average. The previous week's average was revised up by 500 from 231,000 to 231,500.
According to Reuters, the initial claims were just below their estimate of 240,000 and "Labor market tightness is underpinning the economy, with data this week showing a solid increase in retail sales in July and a surge in single-family homebuilding, which prompted economists to raise their growth estimates for the third quarter. But that resilience raises the risk that the Federal Reserve could hike interest rates again." The stock market is down this week.
| State | July 2023(P) rate |
Rank |
|---|---|---|
|
New Hampshire |
1.7 | 1 |
|
Maryland |
1.8 | 2 |
|
Vermont |
1.8 | 2 |
|
South Dakota |
1.9 | 4 |
|
Nebraska |
2.0 | 5 |
|
North Dakota |
2.0 | 5 |
|
Alabama |
2.1 | 7 |
|
Maine |
2.4 | 8 |
|
Utah |
2.4 | 8 |
|
Massachusetts |
2.5 | 10 |
|
Montana |
2.5 | 10 |
|
Virginia |
2.5 | 10 |
|
Arkansas |
2.6 | 13 |
|
Wisconsin |
2.6 | 13 |
|
Florida |
2.7 | 15 |
|
Iowa |
2.7 | 15 |
|
Kansas |
2.7 | 15 |
|
Missouri |
2.7 | 15 |
|
Oklahoma |
2.7 | 15 |
|
Hawaii |
2.8 | 20 |
|
Idaho |
2.8 | 20 |
|
Rhode Island |
2.8 | 20 |
|
Colorado |
2.9 | 23 |
|
Minnesota |
3.0 | 24 |
|
Mississippi |
3.0 | 24 |
|
Wyoming |
3.0 | 24 |
|
South Carolina |
3.1 | 27 |
|
Tennessee |
3.1 | 27 |
|
Georgia |
3.2 | 29 |
|
Indiana |
3.3 | 30 |
|
North Carolina |
3.3 | 30 |
|
Ohio |
3.3 | 30 |
|
Louisiana |
3.4 | 33 |
|
Oregon |
3.4 | 33 |
|
West Virginia |
3.4 | 33 |
|
Pennsylvania |
3.5 | 36 |
|
Arizona |
3.6 | 37 |
|
Connecticut |
3.6 | 37 |
|
Michigan |
3.6 | 37 |
|
New Mexico |
3.6 | 37 |
|
Washington |
3.6 | 37 |
|
Alaska |
3.8 | 42 |
|
Kentucky |
3.8 | 42 |
|
New Jersey |
3.9 | 44 |
|
New York |
3.9 | 44 |
|
Illinois |
4.0 | 46 |
|
Delaware |
4.1 | 47 |
|
Texas |
4.1 | 47 |
|
California |
4.6 | 49 |
|
District of Columbia |
5.0 | 50 |
|
Nevada |
5.3 | 51 |
|
Footnotes |
||
|
Note: Rates shown are a percentage of the labor force. Data refer to place of residence. Estimates for the current month are subject to revision the following month. |
||
Last Modified Date: August 18, 2023
The Unemployment and Jobs Report for August is scheduled to be released on Tuesday, September 19th, 2023 at 10:00 a.m.
Source: 8.18.2023. Vermont Department of Labor www.vtlmi.info.