
by Timothy McQuiston, Vermont Business Magazine State economists Jeff Carr (for the Administration) and Tom Kavet (for the Legislature) today provided their regular July revenue report to the Emergency Board at the Governor’s Ceremonial office at the State House in Montpelier. Their consensus report again showed the state’s tax revenues surging.
As a caveat, the report was completed just before flooding hit the state. They said the effects of which will not be known for several months. But it will not slow down the local economy or revenue expectations. To that end, they expect $78.4 million more in General Fund receipts than their revenue report from January expected for the new fiscal year (FY24) and another $18.3 million next year (FY25). The fiscal year began July 1.
Interest rates and corporate income will drive continued surpluses in the General Fund. New transportation taxes implemented this year will drive Transportation Fund revenues, while the consumption taxes that the Education Fund count on will remain steady.
It does not appear that the personal income tax will rebound over the next couple fiscal years to pandemic levels, but will remain relatively high historically. The PI is the single most important General Fund revenue source.
Meanwhile, the unemployment rate continues to fall, and is now at lowest level on record in Vermont (1.9%). Labor remains very tight here and across the nation with no relief in sight.
The interest rate hikes have had equal and opposite effects on revenues. On the one hand, they increased interest rates which led to greater revenues where the state is sitting on piles of cash, much of which is leftover and being waited on to be spent from COVID.
On the other hand, the Fed’s rate increase has slowed inflation but so far has not led to a recession. The economists are reluctant to guess as to whether it will but admitted that the nation is “not out of the woods” yet.
Home price inflation has continued, though slower. Still, Vermont has the highest housing price increase in New England.
The recovery from Flood23 could in fact stimulate economic activity, in a smaller way than the COVID-19 pandemic ultimately did.
Along with interest rates, Carr said that changes in corporate tax structure, along with a more diversified and broader corporate presence in Vermont has expanded revenue opportunities. He also said "nexus" (local corporate presence in the state) has broadened the corporate tax base.
He told VermontBiz that he feels that a significant percentage of those who relocated to Vermont during the pandemic will remain here.
Asked why the PI decline in the second half of FY23 (ending June 30, 2023), he said it could be from a reduction in mergers and acquisitions and the subsequent loss of income from that. He didn't have a strong sense of why PI refunds were also down.
Carr (Economic & Policy Resources in Williston) said the continuing workforce shortage is in part due to Vermont being "the land of babyboomers," who are now retiring. Asset growth even allowed many to retire earlier than expected, some of whom have since returned to the workforce as the stock market faltered over the last year (it has recently rebounded). He also said the PI could have been affected by people making higher wages now and deciding they no longer needed to work two or three jobs.
Despite a steep reduction in inflation and continued strength in revenues and the labor situation, the economists were still concerned that a recession this year was still possible. They also doubted that the inflation rate could fall as far as to 3%, never mind the Fed target of 2%. Already, energy prices have started to head back up. Gasoline prices increased here and across the US more than 10 cents per gallon in the last week.
Below is the verbatim report provided by Kavet, from the firm Kavet, Rockler & Associates, LLC, of Williamstown.
Economic Review and Revenue Forecast Update (click for full report)
July 2023
Overview
Little has changed since our January economic and revenue review. The Fed is still pushing hard to slow the economy so as to bring down inflation, while businesses, government and consumers are still resisting decline with buoyant investment, hiring and spending. Although almost everyone expects a significant economic slowing in FY24, the latest data suggest surprising resiliency and improvement on the inflation front that could provide some upside to the near-term revenue outlook - if everything goes right. Total FY23 revenues for the three major funds forecast herein closed 1.2% (about $39M) above prior projections. Although a significant decline in General Fund revenue is still likely in FY24, it will be about $78M less than previously forecast, as interest income soars and corporate income proves more resistant to decline. Fee increases affecting the Transportation Fund enacted during the last legislative session will more than offset continued tax base weakness and lead to an upgrade over the forecast horizon. The Education Fund will benefit from both additional interest income and less cyclicality in the three large consumption taxes that underpin it, also resulting in slightly higher revenues than previously projected. Although neither the TFund nor EFund are expected to decline in FY24 or FY25, growth will still slow dramatically from the elevated levels of the past several years.
What About the Flood?
• Shortly after the macroeconomic analysis underlying this economic and revenue update was completed, major rainfall and flooding inundated many parts of the State, causing severe property damage in a number of low-lying areas. At this time, there is insufficient data with which to analyze and quantify potential economic and revenue impacts from this event. As soon as such information becomes available, we will review and assess potential material impacts to this analysis and recommend adjustments upon request.
• The early flood damage assessments varied greatly across the State and at varying elevations within the hardest hit regions. The above map was based on initial reports from Vermont Emergency Management local liaisons assigned by local regional planning commissions and lacked any official definition of “major” or “minor” damage to inform these reports.
• It should be noted that net economic impacts from disasters such as this can be counterintuitive. Much of the economic loss occurs to wealth, as existing buildings and infrastructure are damaged and destroyed. However, flows of economic activity such as income, employment, consumption and GDP are often initially compromised, as businesses close and economic activity grinds to a halt, but can rebound and even exceed prior flows if there are public or private insurance funds available for remediation. In the flood of 1927, there was comparatively little outside federal aid and it took the State many years to self-fund and fully recover. Earlier flooding events, such as the “June Freshet” in 1821 affecting the southern part of the State, had even more permanent effects, with some settlements reduced or abandoned for many years.
Today, an event like this - that qualifies for outside federal disaster aid and includes many privately insured properties - can perversely result in greater net economic output than would have occurred in the absence of the event. As the destroyed wealth is rebuilt, vast expenditures pour into the State, most of which are not paid by State residents. Because of this, it is difficult to unequivocally conclude that the net impact of this event on the Vermont economy, as measured by the flows most affecting State revenues, will necessarily be negative. Because the event occurred at the start of the fiscal year, even if there are initial months that suffer net losses, by the end of the fiscal year there could be offsetting remedial spending that creates a net gain.
Because one the areas hardest hit was Montpelier, there will be significant impacts on some of the reporting and processing of FY24 revenues. Whereas most revenues are now remitted electronically, those processed with paper have required the relocation of machinery and personnel to temporary locations. In a lasting pandemic benefit, the capacity for many Tax and other State personnel to seamlessly work remotely has minimized the operational impact of this event on State government. We also note that the support we received from Tax, JFO, the Department of Liquor and Lottery, the Treasurer’s Office and others in preparing this report during this difficult time was extraordinary.
The widespread scientific association of this event with broader climate change brings into question the reliability of extant federal flood data, which is derived from past rainfall observations that do not take into account climate change. Based on this data, the recent storm had less than a 1 in 100 chance of occurring in any given year and yet it rivaled the devastation of another 1 in 100-chance storm 12 years ago (see map on preceding page). Climate scientists have long predicted that warming temperatures (and both this June and July registered new global heat records) would increase the moisture the air can hold and lead to destructive bursts of rainfall. The director of the National Oceanic and Atmospheric Administration’s Northeast Regional Climate Center said: “This, to me, is almost as classic a signal as warm temperatures. In a warmer world, this is what you would expect.” If so, we should pay as much attention (and money) to minimizing ever-more-likely future damage as we do to repairing the present destruction.
Economic, Fiscal and Monetary Policy Update
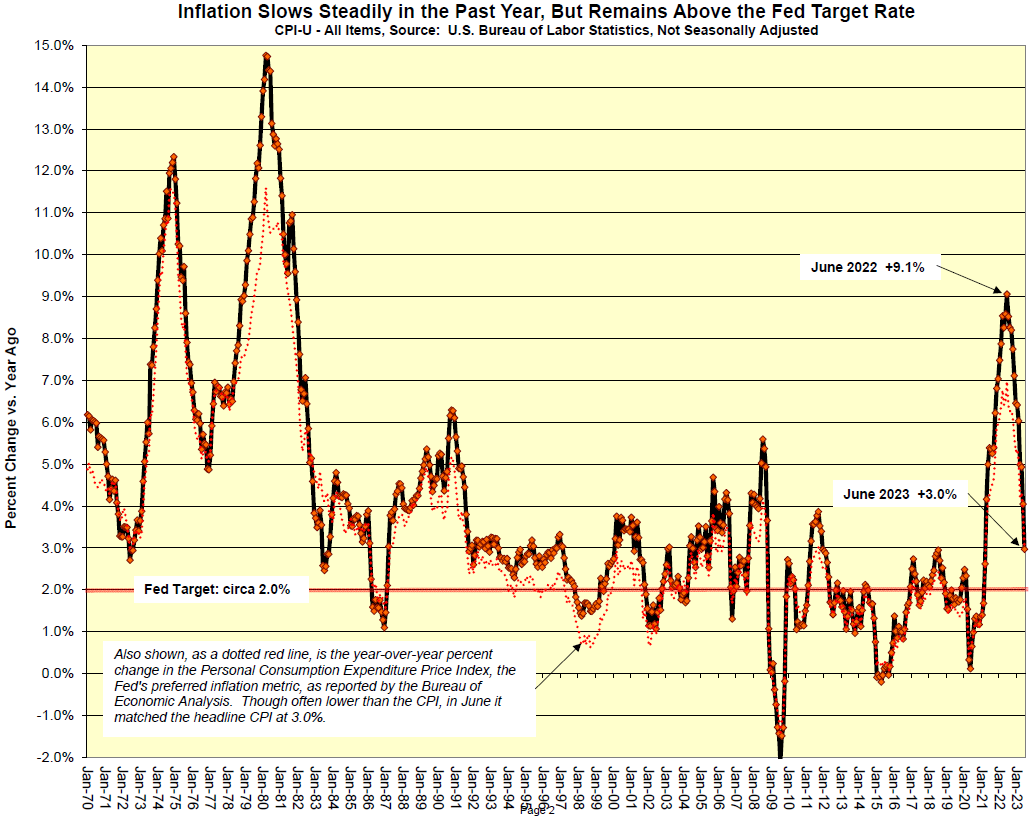
Hopeful winds are blowing in with the most recent economic data. Inflation is slowing steadily, with both the CPI and PCEI dropping to 3% (year-over-year change), while at the same time, the unemployment rate is hovering at or near all-time lows, U.S. job growth remains robust, consumer spending is steady, with sentiment improving, business investment is solid and real GDP recently clocked in at 2.4% in the second quarter – close to its potential. All this lends support to “Goldilocks” optimists who believe it may yet be possible to bring down inflation without as much attendant economic pain as has been necessary in the past.
• Others argue it’s way too early to be swayed by a few good numbers and point out that much of the reduction in inflation in the last year has come from declining energy prices, which could reverse, and that wage demands usually lag price changes and “salary catch-up” in a tight labor market could result in sustained upward pressure on prices. The recent proliferation of organized labor actions and threatened strikes underscores such fears.
• There is no doubt the labor market is tight, with job openings still substantially exceeding the number of persons unemployed – both in the U.S. and in Vermont. The “quit rate,” which had been declining from its previous record highs jumped again in May to an unprecedented 4.4%. The U.S unemployment rate was at 3.6% in June, close to its 54 year low reached in April and January of this year. Vermont’s unemployment rate in June matched its all-time low at 1.9% and was the third best in the nation, after New Hampshire and South Dakota. These conditions would be celebratory, except that they could also presage future wage growth that would prompt the Fed to keep raising interest rates. Although the Employment Cost Index dropped to 4.5% in June, down from 5.1% a year ago, it would have to decline to at least 3.5% to be compliant with the Fed’s 2.0% inflation target (assuming 1.5% productivity gains).
• While the Fed may yet raise interest rates again this year, the macroeconomic forecasts upon which this update is based assumes the Fed’s July 26th increase to a 5.50% upper target to be the terminal rate. The lagged effects of a 5 basis point hike over 15 months, raising rates to their highest level in 22 years, however, have yet to be fully felt and will not be exerting maximum downward pressure on the economy and related State revenues until FY24 and FY25.
• Reflecting these lags, the latest home price data (through the first quarter of 2023) still show year-over-year price growth in every state except DC (-1.0%). The number of states with growth over 10%, however has dropped from 51 states in the second quarter of 2022, to 34 states in the fourth quarter of 2022, to 15 states in the most recent quarter. Vermont is still among them, with 12.6% growth since the same quarter in 2022, the highest among any of the New England states and the fourth highest in the nation.
• The states with the lowest home price growth in the first quarter of 2023 were mostly western states that had seen enormous price increases during this real estate cycle and were the ripest for decline. Aside from DC, the lowest growth rates were in OR, NV, WA, CA, UT, ID, AZ and CO, where price growth ranged from 2% to just under 5%. All of these states experienced multiple quarters of growth in excess of 20% in the last 2 years.
• Offsetting the intentions of the Fed to slow the economy, there is still a high level of savings and other retained wealth, as well as unspent funds from prior federal stimulus programs (such as those now swelling Vermont State cash balances). Both household and business balance sheets remain healthy as reflected in the net worth statistics presented in the last economic and revenue forecast, and updated with the most recent Federal Reserve data (through first quarter of 2023) in the table on the following page.
• Although these data show a decline (-2.7%) in total net worth from peak levels in the first quarter of 2022, total net worth is still more than $30T above prepandemic levels and about $10T above a “no pandemic” trajectory. This indicates ample capacity for consumers and businesses to continue to spend and invest, though it is now about $5T below the gap in January.
• The latest net worth data show a decline in the share of net worth owned by the bottom 50% of the net worth percentile distribution in the last year. After rising from 1.9% of total net worth prior to the pandemic to 2.6% last year, in the first quarter of 2023 it dropped to 2.4%. While a seemingly small decline, on an average household basis this represents a loss of wealth from $58,083 to $53,143, an 8.5% decline of close to $5,000 per household. Although the average household net worth for this group is still more than $20,000 higher than its pre-pandemic level, on a dollar basis, it pales when compared to the increases of the next 40 percent ($149,684 per household), the next 9 percent ($827,164 per household), the next 0.9% ($4,743,106 per household) and the top 0.1 percent ($33,508,172 per household).
State Revenue Update
• Total revenues across all three major State funds closed FY23 1.2% above projections, representing about $39 million on a base of $3.2 billion. General Fund revenues were 2.0% above targets (+$43M), the Transportation Fund was 1.3% below target (-$3.9M) and the Education Fund was essentially spot on, with a -0.02% variance, -$0.1M under target. The largest subcategory strength was in interest income (72.3% above target) and corporate income (+27.1%), with the most significant weakness in personal income (-4.2%) and the hospital provider tax (-5.6%). Interest and corporate income are also the sources of most of the additional $78.4M in FY24 GFund revenue expected, relative to prior January projections.
• In FY21, income from interest on State cash balances generated a scant $0.9M to the General and Education Funds combined. In FY22, it yielded $2.6M. In the 45 years between FY77 and FY22, interest income averaged just over $3M per year. In FY23, it rose to an astonishing $56.9M, more than 18 times the preceding 45-year average and more than triple the revenue previously forecast. Most of this Source interest income flows to the General Fund (averaging about 86% over the past 6 years), with the remainder (usually between about 10%-20%) going to the Education Fund. Although there are many smaller funds that receive interest income, most of which are not in the three large funds forecast herein, the GFund and EFund represent about 70%- 80% of all interest earned on balances managed by the State Treasurer.
• The extraordinary income received in FY23 is a function both of the phenomenal federal fiscal largesse during and beyond the pandemic and the rapid rise in interest rates over the past two years. Because much of the recent federal spending has longer “expiration dates” for expenditure than the immediate pandemic funding, and there are significant backlogs involved in utilizing these funds, a great deal of this cash is now being held in interest bearing accounts by the State until it can be deployed. The ancillary impacts of the massive federal spending have also expanded State revenues at the same time vacancies in State government positions following the pandemic have reduced expenditures. The effect of these events on average daily State cash balances can be seen in the chart on the following page, which depicts a decade of “normal” balances in the $200 to $500 million range that have soared to more than $2 billion over the past several years.
• FY24 is likely to see even higher interest income as both average cash balances and effective interest rates top FY23 levels. Even using very conservative assumptions, we expect to receive at least $79M in interest income in FY24, with about $70M landing in the GFund and $9M in the Efund. This will make it the fifth largest source of General Fund revenue in FY24. We expect a fairly rapid drawdown of federally-sourced funds between FY24 and FY26, along with gradually declining interest rates, such that total Source interest income will decline to about $20M by FY28.
• Corporate income tax (CIT) revenue also set new records in FY23, soaring to $281M, and besting forecast expectations by about $60M. Although vulnerable to decline in FY24, it is now expected to exceed prior projections by about this same margin. This is due to both structural changes in the State taxation of corporations, a higher than usual inflationary environment, and adjustments for revenue outliers in FY23.
• In a granular analysis of recent corporate income tax payments with the Tax Department, we found that between FY19 (pre-pandemic and before Vermont’s change to market-based sourcing) and FY23, less than half of those making CIT payments in FY19 also made payments in FY23. Although there were only about 3% more payers in FY23, there was a great deal of churning in the tax base, with more than 8,000 payers disappearing and a slightly higher number of new payers in FY23. Of those paying in both FY19 and FY23, aggregate payments increased by about 66%, representing more than $50M, despite about 20% of this group paying less in FY23 than FY19. Of those paying in FY19 but not FY23, revenues totaled about $37M, while among those paying in FY23 but not FY19, revenues totaled about $73M, a gain of about $36M. While some of this data can be skewed by corporate name changes, lengthy carry-forwards and typographical data entry errors, it appears these represent a small number of payers in the two files.
• Most notable, is the change in payer profiles and CIT liabilities that are likely to be attributable to market-based taxation. The distribution of payers is not as top-heavy as in FY19 and earlier, and has a wider upper-middle segment of payers in the $100K-$2M range. Despite a great deal of volatility in individual firm payments from year to year, there appears to be more stability in payments with the more recent mix of payers than previously. It also appears that there may have been growing compliance with the new tax regime over the past several years. All this supports a higher floor to corporate income receipts over the forecast horizon, despite expected declines in both FY24 and FY25, as inflation cools and the economy slows. As shown in the chart on the following page, U.S. corporate profits in the first quarter of 2023 declined for the first time in 10 quarters, slipping 1.8% below earnings in the same quarter of 2022.
• The inflationary environment in FY23 was also a contributing factor to high corporate liabilities and State receipts. Corporations with pricing power have used inflationary cover to increase margins – raising prices above costs and keeping them intact even when costs decline. While this will be harder to do as inflation recedes, it will still be an important element in evaluating corporate liabilities in FY24 and beyond.
• Personal income taxes were expected to decline in FY23, but closed the fiscal year well below (-4.2%) expectations and are likely to decline again in FY24. Despite PI withholding taxes coming in slightly above target (1.7%) and less refunding (5.7%) than anticipated, paid returns were exceptionally weak (-20.9%), which also pulled down fourth quarter and annual estimated taxes (-5.9%). Other PI revenues were also about 4.5% below expectations. As the economy slows in FY24, along with lower wage gains, withholding tax revenue will also weaken, in addition to continued lower estimated and paid taxes.
• The major consumption taxes supporting the Education Fund were close to target in FY23, with sales and use revenues about 1% below target, meals and rooms about 2% above target and motor vehicle purchase and use receipts about 3% below prior estimates. Much of the negative variance appeared in the final quarter of the fiscal year, indicating early signs that higher interest rates and cumulative inflation may be beginning to dent demand. This downward pressure will intensify throughout FY24 and continue into FY25, leading to slower revenue growth, but no outright declines for these large revenue sources. All this, plus $3M-$9M per year from interest income will result in slight upward adjustments of $10M-$20M per year in Education Fund revenue over the forecast horizon, relative to the prior January forecast.
• The Transportation Fund ended FY23 1.3% below levels forecast in January. Much of the weakness was in the last quarter of the fiscal year, indicating some slowing in related economic activity that is expected to continue into FY24. Lower gas prices in FY24 will also negatively impact price-sensitive fuel tax revenues, such as the motor fuel assessment and TIB taxes, which benefitted from higher prices in FY23. Several statutory changes (Acts 78, 19 and 41) to T-Fund fees made during the last legislative session will go into effect in January of 2024, offsetting these declines and adding significant revenue to motor vehicle fees, other revenue and motor vehicle purchase and use receipts, mostly in FY25 and beyond. Weakness in underlying tax base growth for much of the T-Fund, however, will blunt revenue growth beyond FY25, leaving it below 2% per year.
• The U.S. and Vermont macroeconomic forecasts upon which the revenue forecasts in this update are based are summarized in Tables A and B on the following two pages, and represent a consensus JFO and Administration forecast developed using internal JFO and Administration State economic models with input from Moody’s Analytics June 2023 projections and other major forecasting entities, including the Federal Reserve, EIA, CBO, IMF, The Conference Board and other private forecasting firms with whom we interact.
Methodological Notes and Other Comments
• This analysis has benefited significantly from the input and support of Tax Department and Joint Fiscal Office personnel. In the Joint Fiscal Office, Emily Byrne, Chris Rupe, Joyce Manchester, Pat Titterton, Ted Barnett, Sarah Clark, Nolan Langweil, Dan Dickerson, Julia Richter and Sorsha Anderson have contributed to numerous policy and revenue impact analyses and coordinated JFO forecast production and related legislative committee support functions. They have also painstakingly organized and updated large tax and other databases in support of JFO revenue forecasting activities. In the Tax Department, Sharon Asay, Jennifer McNall, Ian Kimmel, Renae DiGregorio, Jake Feldman, Erin Hicks-Tibbles, and Rebecca Sameroff provided important data and analytic contributions to many tax and revenue forecasts, including tax law change analyses and statistical and related background information associated with the detailed tax databases they oversee. In the Treasurer’s Office, Jeremiah Breer, Dan Currier, Scott Baker, John Booth, Gavin Boyles and Treasurer Pieciak provided essential information in analyzing and forecasting interest income. In the Department of Liquor and Lottery, Commissioner Knight and supporting analysts provided important data and insights into Lottery issues affecting FY23 and future revenues. Our thanks to all of the above for their many contributions to this analysis.
• The analysis in support of JFO economic and revenue projections are based on statistical and econometric models, and professional analytic judgment. All models are based on 46 years of data for each of the 25 General Fund categories (three aggregates), 43 years of data for most of the Transportation Fund categories (one aggregate), and 24 to 45 years for each of the Education Fund categories. The analyses employed includes seasonal adjustment using U.S. Census Bureau X-13-ARIMA-SEATS and TRAMO-SEATS methods, various moving average techniques (such as Henderson Curves, etc.), Box-Jenkins ARIMA type models, pressure curve analysis, comparable-pattern analysis of monthly, quarterly and half year trends for current year estimation, and behavioral econometric forecasting models.
• Because the State does not currently fund an internal State or U.S. macroeconomic model, this analysis relies primarily on semi-annual macroeconomic models from Moody’s Analytics with consensus model adjustments made by JFO and Administration economists using a customized Moody’s on-line Vermont model prepared during the month preceding the revenue forecast. Dynamic and other input/output-based models for the State of Vermont, including those from Regional Economic Models, Inc. (REMI), Regional Dynamics, Inc. (REDYN), and IMPLAN are also maintained and managed by the JFO and KRA for use in selected economic impact and simulation analyses used herein.
• The Consensus JFO and Administration forecasts are developed following discussion, analysis and synthesis of independent revenue projections, econometric models and source data produced by Administration and Joint Fiscal Office economists.