Vermont Business Magazine Average gasoline price in Vermont is $3.60/g, up 2 cents per gallon from last week, up 13 cents from last month and down $1.39 from a year ago. The lowest price in the state is $3.30/g in Middlebury, while the highest was $3.89/g in Island Pond (see statewide heat map below).
Meanwhile, average gasoline prices in Burlington have risen 1 cent per gallon in the last week, averaging $3.61/g today, according to GasBuddy's survey of 100 stations in Burlington. Prices in Burlington are 12.5 cents per gallon higher than a month ago and stand 138.9 cents per gallon lower than a year ago.
According to GasBuddy price reports, the cheapest station in Burlington was priced at $3.55/g yesterday while the most expensive was $3.69/g, a difference of 14.0 cents per gallon.
The national average price of gasoline has fallen 1 cent per gallon in the last week, averaging $3.55/g today. The national average is up 3 cents per gallon from a month ago and stands $1.40 cents per gallon lower than a year ago, according to GasBuddy data compiled from more than 11 million weekly price reports covering over 150,000 gas stations across the country. The highest prices are in the Pacific states and the lowest are in the Southwest.
The national average price of diesel has fallen 3.7 cents in the last week and stands at $3.85 per gallon.
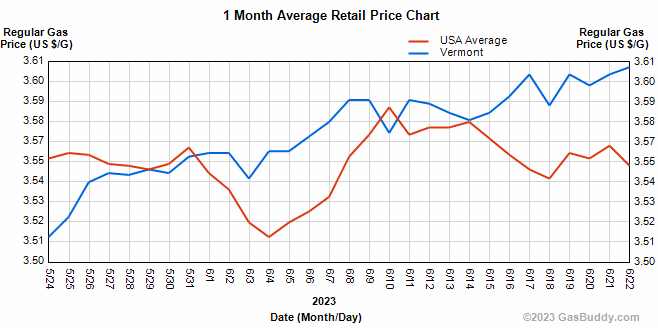
Statistics
| Vermont | USA | Trend | |
|---|---|---|---|
| Today | 3.608 | 3.553 |  |
| Yesterday | 3.603 | 3.564 | |
| One Week Ago | 3.582 | 3.568 | |
| One Month Ago | 3.478 | 3.524 | |
| One Year Ago | 4.993 | 4.950 | |
| * Average Regular Gas Prices - Updated: 6.22.2023. 1:35 PM | |||
Historical gasoline prices in Burlington and the national average going back ten years:
June 20, 2022: $5.00/g (U.S. Average: $4.97/g)
June 20, 2021: $2.97/g (U.S. Average: $3.05/g)
June 20, 2020: $2.08/g (U.S. Average: $2.12/g)
June 20, 2019: $2.74/g (U.S. Average: $2.66/g)
June 20, 2018: $2.99/g (U.S. Average: $2.87/g)
June 20, 2017: $2.41/g (U.S. Average: $2.28/g)
June 20, 2016: $2.36/g (U.S. Average: $2.33/g)
June 20, 2015: $2.78/g (U.S. Average: $2.80/g)
June 20, 2014: $3.75/g (U.S. Average: $3.68/g)
June 20, 2013: $3.60/g (U.S. Average: $3.60/g)
Neighboring areas and their current gas prices:
Albany- $3.71/g, unchanged from last week's $3.71/g.
New Hampshire- $3.49/g, up 1.9 cents per gallon from last week's $3.47/g.
"It has been a quiet week for the national average, with little overall movement in average gas prices nationally even as oil prices have been a bit unstable. Some states have seen minor increases while others have seen decreases, and the mixed bag is likely to continue for the time being with oil prices a bit all over the place," said Patrick De Haan, head of petroleum analysis at GasBuddy. "While gasoline demand continues to inch up, we could see additional pressure on pump prices, while the price of diesel continues to see downward movement. While the uncertainty over the direction of the economy is a major player in preventing oil's rise, inventories of oil and gasoline do remain tight, preventing much additional downward movement as well. We'll have to see which of those factors emerges as a winner to predict when the next large movement in prices could be. We're also seeing more tropical activity in the Atlantic that could pose challenges in the weeks ahead as hurricane season ramps up."
Vermont Gasoline Heat Map

GasBuddy is the authoritative voice for gas prices and the only source for station-level data. GasBuddy's survey updates 288 times every day from the most diverse list of sources covering nearly 150,000 stations nationwide, the most comprehensive and up-to-date in the country. GasBuddy data is accessible at http://prices.GasBuddy.com.
SOURCE 6.20.2023. GasBuddy. Boston.