Senator Welch, Governor Scott and friends at the Connor Maple Farm in St Albans celebrate the official first tapping in March 2023. VAAFM photo.
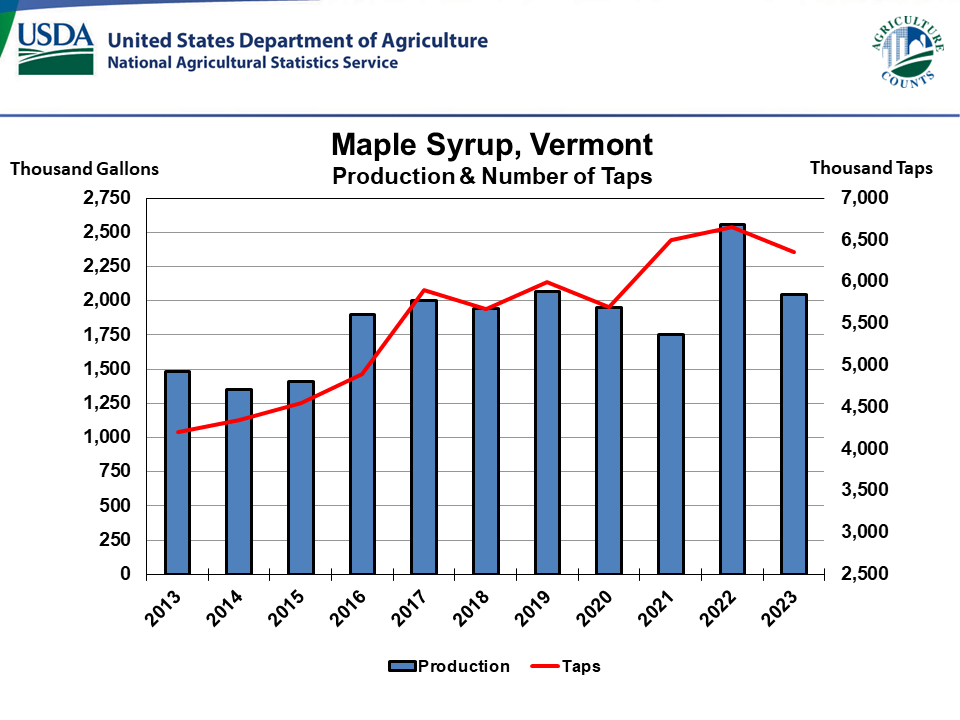
Vermont Business Magazine The 2023 Vermont maple syrup production totaled 2.05 million gallons, down 20% from the previous year’s record-breaking production, according to King Whetstone, director of the USDA’s National Agricultural Statistics Service, Northeastern Regional Field Office. Vermont remains the top producing state in the Nation.
Vermont maple syrup producers put out 6.35 million maple taps in 2023, a decrease of 5% from the 2022 total.
Vermont has led the US in the number of maple taps every year since 1916 and was only out produced in 1926 and 1918. Yield per tap is estimated to be 0.322 gallon, down from 0.384 gallon from the previous season. Location played a significant part in individual production.
Vermont’s 2022 value of production totaled a record high $84.5 million, up 51% from the previous season and nearly half the US total. The average price per gallon was $33.10 per gallon, up $1.10 from 2021. The value ofthe 2023 is not yet available.
Vermont’s Ag Secretary Anson Tebbetts adds, “It was a roller coaster year for Vermont sugar makers but once again they rolled with weather and produced a high-quality crop of pure Vermont maple syrup. We are grateful to all our producers for their hard work and look forward to enjoying maple for breakfast, lunch and dinner.”
UNITED STATES: Maple syrup: The 2023 United States maple syrup production totaled 4.18 million gallons, down 15 percent from the previous season. The number of taps totaled 13.4 million, down 4 percent from the 2022 total. Yield per tap was 0.311 gallon, down 0.042 gallon from the previous season.
The 2022 United States average price per gallon was $34.70, down $1.20 from 2021. Value of production, at $172 million for 2022, was up 28 percent from the 2021 season.
| Crop Production: Released June 9, 2023, by the National Agricultural Statistics Service (NASS), Agricultural Statistics Board, United States Department of Agriculture (USDA). | |||||||||
| Maple Syrup Taps, Yield, and Production – States and United States: 2021-2023 | |||||||||
|
Number of taps |
Number of taps |
Number of taps |
Yield per tap |
Yield per tap |
Yield per tap |
Production | Production | Production | |
| State | |||||||||
| 2021 | 2022 | 2023 | 2021 | 2022 | 2023 | 2021 | 2022 | 2023 | |
|
(1,000 taps) |
(1,000 taps) |
(1,000 taps) |
(gallons) | (gallons) | (gallons) |
(1,000 gallons) |
(1,000 gallons) |
(1,000 gallons) |
|
| Maine | 1960 | 1860 | 1880 | 0.262 | 0.341 | 0.25 | 514 | 634 | 470 |
| Michigan | 550 | 560 | 590 | 0.273 | 0.336 | 0.33 | 150 | 188 | 195 |
| New Hampshire | 530 | 500 | 460 | 0.24 | 0.308 | 0.302 | 127 | 154 | 139 |
| New York | 2900 | 2800 | 2500 | 0.223 | 0.291 | 0.3 | 647 | 815 | 750 |
| Pennsylvania | 745 | 710 | 675 | 0.226 | 0.219 | 0.263 | 168 | 155 | 178 |
| Vermont | 6500 | 6650 | 6350 | 0.269 | 0.384 | 0.322 | 1750 | 2554 | 2045 |
| Wisconsin | 900 | 920 | 985 | 0.406 | 0.481 | 0.408 | 365 | 443 | 402 |
| United States | 14085 | 14000 | 13440 | 0.264 | 0.353 | 0.311 | 3721 | 4943 | 4179 |
| Maple Syrup Sales by Type – States: 2021 and 2022 | ||||||||
| Retail | Retail | Wholesale | Wholesale | Bulk | Bulk | Value Added | Value Added | |
| State | ||||||||
| 2021 | 2022 1/ | 2021 | 2022 1/ | 2021 | 2022 1/ | 2021 | 2022 1/ | |
| (1,000 gallons) | (1,000 gallons) | (1,000 gallons) | (1,000 gallons) | (1,000 gallons) | (1,000 gallons) | (1,000 gallons) | (1,000 gallons) | |
| Maine | (NA) | 30 | (NA) | 74 | (NA) | 527 | (NA) | 3 |
| Michigan | (NA) | 59 | (NA) | 68 | (NA) | 52 | (NA) | 9 |
| New Hampshire | (NA) | 51 | (NA) | 76 | (NA) | 22 | (NA) | 6 |
| New York | (NA) | 171 | (NA) | 158 | (NA) | 447 | (NA) | 38 |
| Pennsylvania | (NA) | 38 | (NA) | 34 | (NA) | 73 | (NA) | 9 |
| Vermont | (NA) | 235 | (NA) | 197 | (NA) | 2092 | (NA) | 31 |
| Wisconsin | (NA) | 35 | (NA) | 76 | (NA) | 330 | (NA) | 2 |
| United States | (NA) | 619 | (NA) | 683 | (NA) | 3543 | (NA) | 98 |
| (NA) Not available. | ||||||||
| 1/ Estimates began in 2022. | ||||||||
| Maple Syrup Retail and Wholesale Price – States: 2021 and 2022 | ||||
| Retail | Retail | Wholesale | Wholesale | |
| State | ||||
| 2021 | 2022 1/ | 2021 | 2022 1/ | |
| (dollars per gallon) | (dollars per gallon) | (dollars per gallon) | (dollars per gallon) | |
| Maine | (NA) | 63 | (NA) | 39.6 |
| Michigan | (NA) | 50.8 | (NA) | 31.9 |
| New Hampshire | (NA) | 59.6 | (NA) | 54.9 |
| New York | (NA) | 53 | (NA) | 43.6 |
| Pennsylvania | (NA) | 45.4 | (NA) | 38.6 |
| Vermont | (NA) | 54 | (NA) | 37.3 |
| Wisconsin | (NA) | 52.7 | (NA) | 35.7 |
| United States | (NA) | 53.7 | (NA) | 40.3 |
| (NA) Not available. | ||||
| 1/ Estimates began in 2022. | ||||
| Maple Syrup Bulk Price – States: 2021 and 2022 | ||||
| Bulk all grades | Bulk all grades | Bulk all grades | Bulk all grades | |
| State | ||||
| 2021 | 2022 | 2021 | 2022 | |
| (dollars per pound) | (dollars per pound) | (dollars per gallon) | (dollars per gallon) | |
| Maine | 3.2 | 2.96 | 35.1 | 32.6 |
| Michigan | 2.4 | 2.58 | 26.8 | 28.4 |
| New Hampshire | 2.4 | 2.33 | 26.4 | 25.7 |
| New York | 2.4 | 2.67 | 26.7 | 29.4 |
| Pennsylvania | 2.5 | 2.51 | 27.6 | 27.7 |
| Vermont | 2.6 | 2.75 | 28.3 | 30.3 |
| Wisconsin | 2.5 | 2.56 | 27.4 | 28.2 |
| United States | (NA) | 2.7 | (NA) | 30.2 |
| (NA) Not available. | ||||
| Maple Syrup Grade – States: 2021 and 2022 | ||||
| Grade A | Grade A | Processing Grade | Processing Grade | |
| State | ||||
| 2021 | 2022 1/ | 2021 | 2022 1/ | |
| (gallons) | (gallons) | (gallon) | (gallon) | |
| Maine | (NA) | 586199 | (NA) | 44801 |
| Michigan | (NA) | 165217 | (NA) | 13783 |
| New Hampshire | (NA) | 137080 | (NA) | 11920 |
| New York | (NA) | 739528 | (NA) | 36472 |
| Pennsylvania | (NA) | 134270 | (NA) | 10730 |
| Vermont | (NA) | 2188308 | (NA) | 335692 |
| Wisconsin | (NA) | 414540 | (NA) | 26460 |
| United States | (NA) | 4365142 | (NA) | 479858 |
| (NA) Not available. | ||||
| 1/ Estimates began in 2022. | ||||
| Maple Sap Sales and Price – States: 2021 and 2022 | ||||
| Sap Sales | Sap Sales | Sap Price | Sap Price | |
| State | ||||
| 2021 | 2022 1/ | 2021 | 2022 1/ | |
| (1,000 gallons) | (1,000 gallons) | (dollars per gallon) | (dollars per gallon) | |
| Maine | (NA) | (D) | (NA) | (D) |
| Michigan | (NA) | (D) | (NA) | (D) |
| New Hampshire | (NA) | 60 | (NA) | 0.27 |
| New York | (NA) | 794 | (NA) | 0.52 |
| Pennsylvania | (NA) | 108 | (NA) | 0.35 |
| Vermont | (NA) | 4634 | (NA) | 0.9 |
| Wisconsin | (NA) | 1487 | (NA) | 0.29 |
| Other States 2/ | (NA) | 104 | (NA) | 1.55 |
| United States | (NA) | 7187 | (NA) | 0.7 |
| (D) Withheld to avoid disclosing data for individual operations. | ||||
| (NA) Not available. | ||||
| 1/ Estimates began in 2022. | ||||
| 2/ Includes data withheld above. | ||||
| Maple Syrup Season – States and United States: 2021-2023 | |||||||||
| Date season | Date season | Date season | Date season | Date season | Date season | Average season | Average season | Average season | |
| opened 1/ | opened 1/ | opened 1/ | closed 2/ | closed 2/ | closed 2/ | length 3/ | length 3/ | length 3/ | |
| State | |||||||||
| 2021 | 2022 | 2023 4/ | 2021 | 2022 | 2023 4/ | 2021 | 2022 | 2023 4/ | |
| (date) | (date) | (date) | (date) | (date) | (date) | (days) | (days) | (days) | |
| Maine | 15-Feb | 5-Feb | (NA) | 30-Apr | 30-May | (NA) | 31 | 36 | (NA) |
| Michigan | 1-Feb | 16-Feb | (NA) | 14-Apr | 30-Apr | (NA) | 25 | 30 | (NA) |
| New Hampshire | 11-Jan | 4-Feb | (NA) | 16-Apr | 28-Apr | (NA) | 26 | 36 | (NA) |
| New York | 1-Jan | 1-Jan | (NA) | 4-May | 2-May | (NA) | 29 | 33 | (NA) |
| Pennsylvania | 4-Jan | 4-Feb | (NA) | 15-Apr | 22-Apr | (NA) | 25 | 27 | (NA) |
| Vermont | 25-Jan | 1-Jan | (NA) | 23-Apr | 16-May | (NA) | 28 | 40 | (NA) |
| Wisconsin | 20-Feb | 20-Feb | (NA) | 10-Apr | 3-May | (NA) | 25 | 34 | (NA) |
| United States | (NA) | (NA) | (NA) | (NA) | (NA) | (NA) | 27 | 34 | (NA) |
| (NA) Not available. | |||||||||
| 1/ Approximately the first day that sap was collected. | |||||||||
| 2/ Approximately the last day that sap was collected. | |||||||||
| 3/ The average number of days that sap was collected. | |||||||||
| 4/ Estimates discontinued beginning in 2023. | |||||||||
| Maple Syrup Average Open and Close Season Dates – States and United States: 2021-2023 | ||||||
| Season Opened 1/ | Season Opened 1/ | Season Opened 1/ | Season Closed 2/ | Season Closed 2/ | Season Closed 2/ | |
| State | ||||||
| 2021 | 2022 | 2023 3/ | 2021 | 2022 | 2023 3/ | |
| (date) | (date) | (date) | (date) | (date) | (date) | |
| Maine | 6-Mar | 4-Mar | (NA) | 6-Apr | 9-Apr | (NA) |
| Michigan | 2-Mar | 9-Mar | (NA) | 28-Mar | 8-Apr | (NA) |
| New Hampshire | 6-Mar | 27-Feb | (NA) | 1-Apr | 4-Apr | (NA) |
| New York | 4-Mar | 28-Feb | (NA) | 2-Apr | 2-Apr | (NA) |
| Pennsylvania | 27-Feb | 24-Feb | (NA) | 24-Mar | 23-Mar | (NA) |
| Vermont | 8-Mar | 28-Feb | (NA) | 5-Apr | 9-Apr | (NA) |
| Wisconsin | 6-Mar | 18-Mar | (NA) | 31-Mar | 20-Apr | (NA) |
| United States | (NA) | (NA) | (NA) | (NA) | (NA) | (NA) |
| (NA) Not available. | ||||||
| 1/ Approximate average opened date based on reported data. | ||||||
| 2/ Approximate average closed date based on reported data. | ||||||
| 3/ Estimates discontinued beginning in 2023. | ||||||
| Maple Syrup Price by Type of Sale and Size of Container – States: 2021 and 2022 | ||||||||||
| Gallon | Gallon | 1/2 Gallon | 1/2 Gallon | Quart | Quart | Pint | Pint | 1/2 Pint | 1/2 Pint | |
| Type and State | ||||||||||
| 2021 | 2022 1/ | 2021 | 2022 1/ | 2021 | 2022 1/ | 2021 | 2022 1/ | 2021 | 2022 1/ | |
| (dollars) | (dollars) | (dollars) | (dollars) | (dollars) | (dollars) | (dollars) | (dollars) | (dollars) | (dollars) | |
| Retail | ||||||||||
| Maine | 61.4 | (NA) | 32.7 | (NA) | 18.1 | (NA) | 10.6 | (NA) | 6.5 | (NA) |
| Michigan | 47.7 | (NA) | 28.4 | (NA) | 14.7 | (NA) | 9.6 | (NA) | 6.8 | (NA) |
| New Hampshire | 65.5 | (NA) | 35.1 | (NA) | 19.9 | (NA) | 11.4 | (NA) | 7.5 | (NA) |
| New York | 45.6 | (NA) | 25.2 | (NA) | 17 | (NA) | 9.6 | (NA) | 5.7 | (NA) |
| Pennsylvania | 41.3 | (NA) | 24.3 | (NA) | 14.2 | (NA) | 8.85 | (NA) | 5 | (NA) |
| Vermont | 46.3 | (NA) | 27.8 | (NA) | 16.2 | (NA) | 11.4 | (NA) | 7.1 | (NA) |
| Wisconsin | 45.2 | (NA) | 26.3 | (NA) | 14.6 | (NA) | 8.8 | (NA) | 6 | (NA) |
| Wholesale | ||||||||||
| Maine | 48.3 | (NA) | 24.8 | (NA) | 14.5 | (NA) | 7.9 | (NA) | (D) | (NA) |
| Michigan | 37.6 | (NA) | 24.9 | (NA) | 14.6 | (NA) | 8.5 | (NA) | 5.7 | (NA) |
| New Hampshire | 48.2 | (NA) | 28.8 | (NA) | 14.2 | (NA) | 8.25 | (NA) | (D) | (NA) |
| New York | 41.5 | (NA) | 23.8 | (NA) | 14.1 | (NA) | 9.1 | (NA) | 4.6 | (NA) |
| Pennsylvania | 39.8 | (NA) | 20.3 | (NA) | 13.4 | (NA) | 7.9 | (NA) | 4.4 | (NA) |
| Vermont | 37.9 | (NA) | 22.3 | (NA) | 13.8 | (NA) | 8.5 | (NA) | 5.1 | (NA) |
| Wisconsin | 40.7 | (NA) | 25.7 | (NA) | 13.2 | (NA) | 7.5 | (NA) | 4.6 | (NA) |
| (D) Withheld to avoid disclosing data for individual operations. | ||||||||||
| (NA) Not available. | ||||||||||
| 1/ Estimates discontinued beginning in 2022. | ||||||||||
| Maple Syrup Percent of Sales by Type – States: 2021 and 2022 | ||||||
| Retail | Retail | Wholesale | Wholesale | Bulk | Bulk | |
| State | ||||||
| 2021 | 2022 1/ | 2021 | 2022 1/ | 2021 | 2022 1/ | |
| (percent) | (percent) | (percent) | (percent) | (percent) | (percent) | |
| Maine | 6 | (NA) | 12 | (NA) | 82 | (NA) |
| Michigan | 27 | (NA) | 15 | (NA) | 58 | (NA) |
| New Hampshire | 71 | (NA) | 14 | (NA) | 15 | (NA) |
| New York | 24 | (NA) | 13 | (NA) | 63 | (NA) |
| Pennsylvania | 30 | (NA) | 14 | (NA) | 56 | (NA) |
| Vermont | 10 | (NA) | 4 | (NA) | 86 | (NA) |
| Wisconsin | 13 | (NA) | 5 | (NA) | 82 | (NA) |
| (NA) Not available. | ||||||
| 1/ Estimates discontinued beginning in 2022. | ||||||

For the complete Maple Syrup statistics, go to the ‘Crop Production’ report at:
https://release.nass.usda.gov/reports/crop0621.pdfoncern/publications/tm70mv177
The ‘Crop Production’ report and all other NASS reports are available online at www.nass.usda.gov.
Source: 6.9.2023. HARRISBURG, PA --- USDA