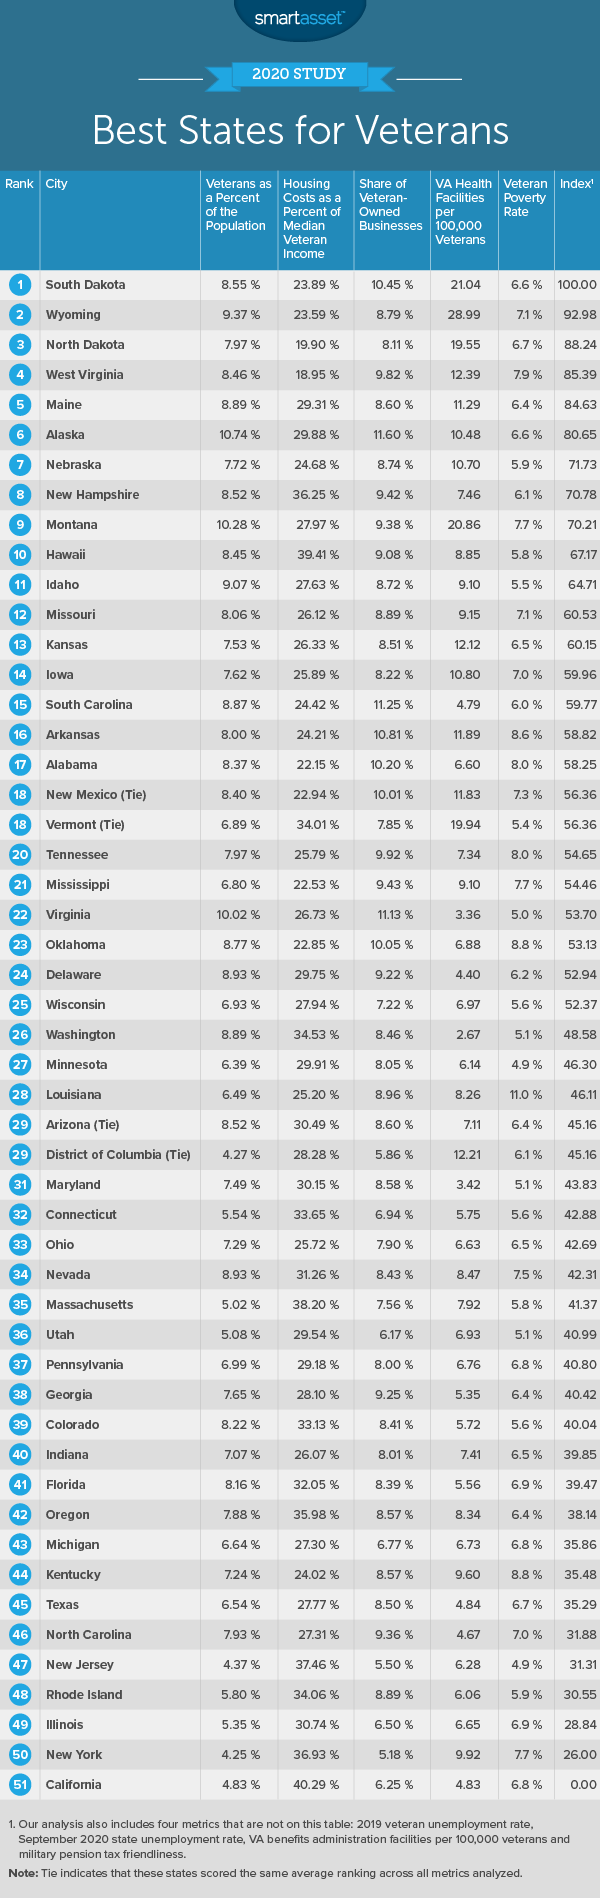
Vermont Business Magazine According to national financial adviser SmartAsset, Vermont ranks 18th among the best states for veterans. Vermont did well in access to health care and had a low poverty rate among veterans. However, housing costs, a common issue in Vermont, was relatively higher here than in most states. Veterans Day is November 11.
How easily veterans adjust to their lives after service depends on many factors, not the least of which is their ability to maintain adequate finances to cover their home payments and daily needs. There’s good news for vets on that front, though: While about 37,000 veterans still experienced homelessness in January 2019, the homelessness rate among veterans declined more than 2% in 2019 and had decreased 50% since 2010, according to a 2019 report from the Department of Housing and Urban Development (HUD). Despite that marked improvement, not all places are equally suited to help veterans thrive. That’s why SmartAsset crunched the numbers in all 50 states and the District of Columbia to find the best places for veterans.
To do so, we looked at data across nine metrics: veterans as a percentage of population, veteran unemployment rate, overall unemployment rate, percentage of veterans living below the poverty line, housing costs as a percentage of median income for veterans, percentage of a state’s businesses owned by veterans, number of VA health centers per 100,000 veterans, number of VA benefits administration facilities per 100,000 residents and taxes on military pensions. For details on our data sources and how we put all the information together to create our final rankings, check out the Data and Methodology section below.
Key Findings
- Veterans are less likely than the general population to live below the poverty line. Nationally, 11.1% of the U.S. population is living in poverty, according to 2019 figures from the Census Bureau. The average for this metric across this study is 6.7%, possibly because military benefits help keep some veterans afloat when they might otherwise face financial challenges.
- More populous states may not be as suitable to veterans. The bottom three states in the study are California, New York and Illinois, which have the largest, fourth-largest and sixth-largest state populations, respectively. These states struggle in two metrics: the unemployment rate for veterans and housing costs as a percentage of median income for veterans. This may be due, in part, to their high populations, which increase both competition for available jobs and demand for housing.
- Pension taxes vary. Each state chooses how to tax military pensions. All in all, 30 states don’t tax military pensions at all, including eight out of the top 10 states (Nebraska and Montana are the exceptions). Military pensions are partially taxed in 13 states, along with the District of Columbia, and they are fully taxed in seven states.
Data and Methodology
To conduct the 2020 version of our study on the best states for veterans, we compared all 50 states and the District of Columbia across the following metrics:
- Veterans as a percentage of the population. Data comes from the Census Bureau’s 2019 1-Year American Community Survey.
- Veteran unemployment rate. Data comes from the Census Bureau’s 2019 1-Year American Community Survey.
- Unemployment rate. Data comes from the Bureau of Labor Statistics and is for September 2020.
- Percentage of veterans living below the poverty line. Data comes from the Census Bureau’s 2019 1-Year American Community Survey.
- Housing costs as a percentage of median income for veterans. This is annual median housing costs divided by median income for veterans. Data comes from the Census Bureau’s 2019 1-Year American Community Survey.
- Share of veteran-owned businesses. This is the percentage of all businesses in a state that are owned by veterans. Data comes from the Census Bureau’s 2018 Annual Business Survey.
- VA health facilities per 100,000 veterans. Data come from the U.S. Department of Veterans Affairs and the Census Bureau’s 2019 1-year American Community Survey.
- VA benefits administration facilities per 100,000 veterans. Data come from the U.S. Department of Veterans Affairs and the Census Bureau’s 2019 1-year American Community Survey.
- Taxes on military pension. States were assigned a 1 if the state does not tax military retirement pay, a 2 if there are special provisions or other considerations for military pension taxes and a 3 if the state fully taxes military retirement pay. Data comes from militarybenefits.info.
First we ranked each state in each metric. From there, we found the average ranking for each state, giving all metrics a full weight except for the two metrics measuring unemployment, which each received a half weight. We used this average ranking to create our final score. The state with the best average ranking received a score of 100, and the state with the worst average ranking received score of 0.
Source: SmartAsset https://smartasset.com/mortgage/best-states-for-veterans-2020.