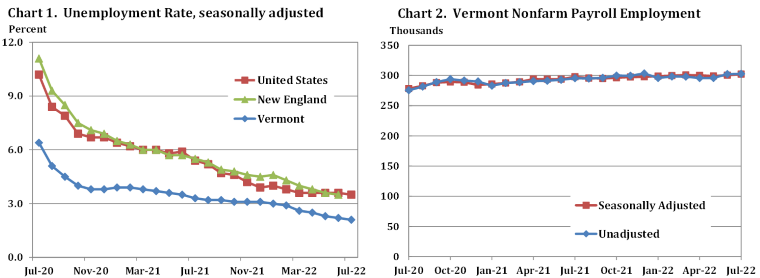
by Timothy McQuiston, Vermont Business Magazine Vermont's seasonally adjusted unemployment rate fell one-tenth in July 2022 to 2.1 percent, according to the Vermont Department of Labor and based on household data. All three major metrics showed positive results, as the labor force and number of employed increased and the number of people looking for work decreased. In addition, the civilian labor force participation rate rose to 61.7 percent in July, up one-tenth from June. The jobless rate has returned to pre-pandemic levels, but the labor force is still far behind and some 20,000 available jobs in Vermont are still unfilled.
The comparable United States jobless rate in July was 3.5 percent, a decrease of one-tenth of one percentage point from the revised June estimate. Vermont has the fifth lowest jobless rate in the nation. New Hampshire is tied for second lowest (2.0 percent) and Minnesota has the lowest at 1.8 percent. Alaska and New Mexico are highest at 4.5 percent (see table below).
The Vermont unemployment rate peaked in April 2020 at 16.5 percent with 57,905 unemployed; the US rate peaked in April at 14.7 percent. Vermont had the lowest unemployment rate in the nation before the pandemic.
Labor Commissioner Michael Harrington said: "Vermont’s labor force has grown, every month this year. This is welcome news for businesses looking to hire, but even with the addition of about 7,000 to the labor force, the labor force in Vermont remains around 20,000 below pre-pandemic levels. The difficulty of hiring for Vermont businesses can be seen in the monthly job openings data which shows 15 consecutive months of total job openings above 20,000. Prior to this streak, the historical data never exceeded this threshold, making this an excellent time for those looking for work or those interested in changing careers. The Department has resources for both jobseekers and those looking to hire, and we would love the opportunity to help, so give us a call or find us online.”
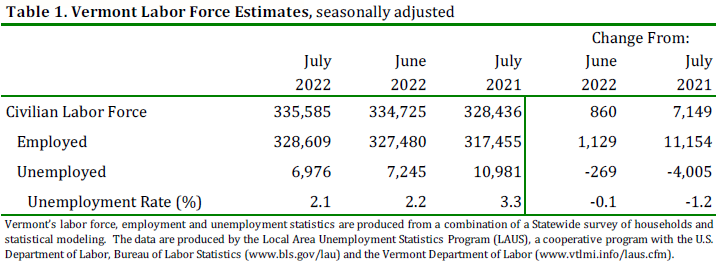
The seasonally-adjusted Vermont data for July show the Vermont civilian labor force increased by 860 from the prior month’s revised estimate (see Table 1). The number of employed persons increased by 1,129 and the number of unemployed persons decreased by 269. The change to the number of employed was statistically significant in the seasonally-adjusted series.
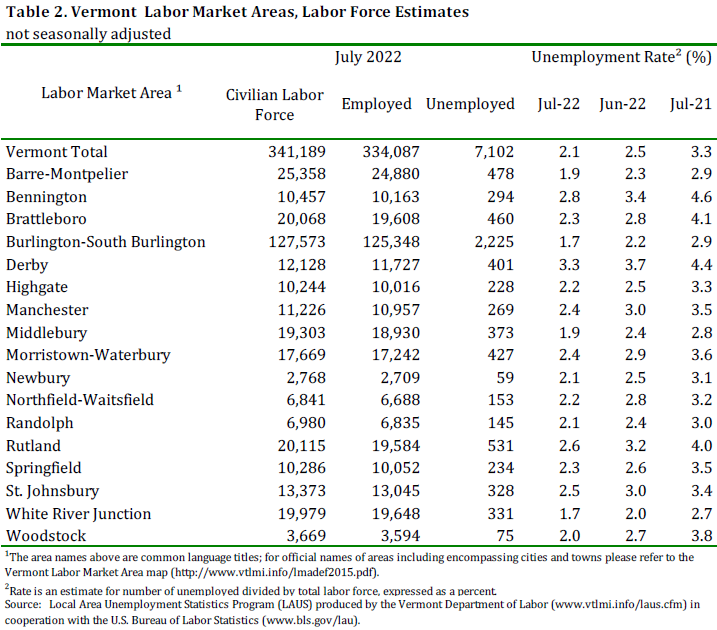
The July unemployment rates for Vermont’s 17 labor market areas ranged from 1.7 percent in White River Junction and Burlington-South Burlington to 3.3 percent in Derby (note: local labor market area unemployment rates are not seasonally-adjusted – see Table 2). For comparison, the July unadjusted unemployment rate for Vermont was 2.1 percent, a decrease of four-tenths of one percentage point from the revised unadjusted June level and a decrease of one and two-tenths percentage points from a year ago.
Weekly unemployment claims continue to hold at a low level, typical of pre-pandemic summer levels. New claims for the week of August 13 were 255, up 25 from the previous week and down 89 from last year. New and continuing claims were 2,316, down 8 from last week and down 2,928 from last year (total claims for all programs, including the now-discontinued federal extended benefits like the PUA, were down 12,643 from last year).
Meanwhile, federal jobless claims last week totaled 250,000, down 2,000 from the previous week and below economists' estimates of 260,000. Continuing claims, which lag a week behind, increased 7,000 to 1.437 million.
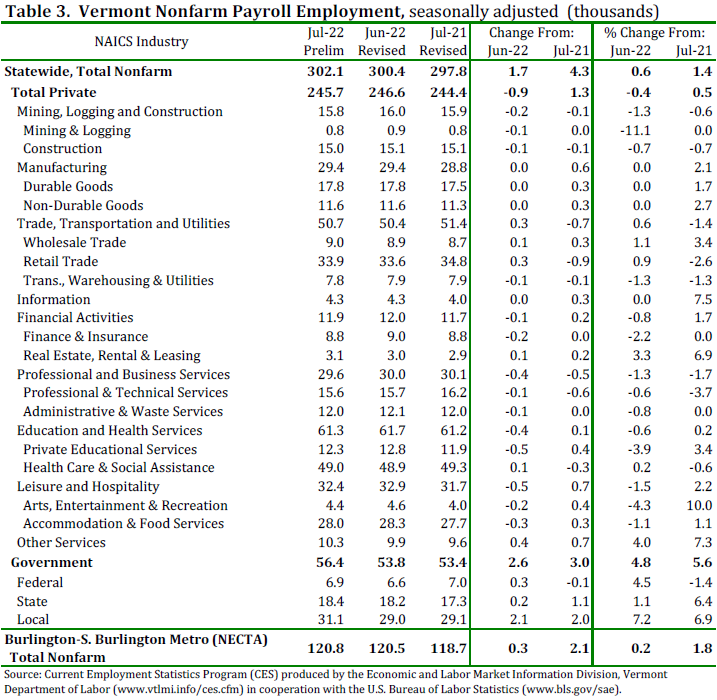
Seasonally-Adjusted (Table 3)
The seasonally-adjusted data for July reported an increase of 1,700 jobs from the revised June data. There was an increase of 1,000 jobs between the preliminary and the revised June estimates due to the inclusion of more data. The seasonally-adjusted over-the-month changes in July were varied at the industry level. Those with a notable increase included: Local Government (+2,100 jobs or +7.2%), Federal Government (+300 jobs or +4.5%), and Other Services (+400 jobs or +4.0%). Industries with a notable decrease included: Arts, Entertainment, and Recreation (-200 jobs or -4.3%), Private Educational Services (-500 jobs or -3.9%), and Finance & Insurance (-200 jobs or -2.2%).
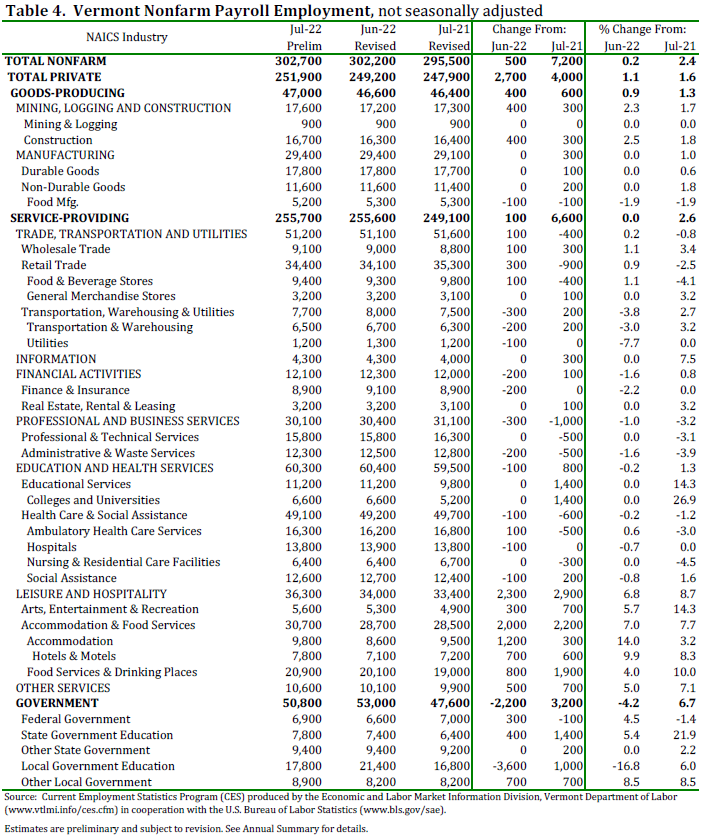
Not-Seasonally-Adjusted (Table 4)
The preliminary ‘not-seasonally-adjusted’ jobs estimates for July showed an increase of 500 jobs when compared to the revised June numbers. As with the ‘seasonally-adjusted’ data, this over-the-month change is from the revised June numbers which experienced an increase of 2,100 jobs from the preliminary estimates. The broader economic picture can be seen by focusing on the over-the-year changes in this data series. As detailed in the preliminary ‘not-seasonally-adjusted’ July data, Total Private industries increased by 4,000 jobs (+1.6%) over the year and Government (including public education) employment has increased by 3,200 jobs (+6.7%) in the past year.
Note: a processing error in the Current Employment Statistics program led to incorrect data being published on July 22, 2022. The error impacted Private Educational Services, Education & Health Services, Total Private and Total Nonfarm Employment estimates for May and June of 2022. VTLMI.info publications and data were updated to reflect the corrected information on August 12, 2022
The Unemployment and Jobs Report for August is scheduled to be released on Friday, September 16 at 10:00 a.m. View the most recent report at VTlmi.info/press.pdf.
| State | July 2022(P) rate |
Rank |
|---|---|---|
|
Minnesota |
1.8 | 1 |
|
Nebraska |
2.0 | 2 |
|
New Hampshire |
2.0 | 2 |
|
Utah |
2.0 | 2 |
|
Vermont |
2.1 | 5 |
|
North Dakota |
2.3 | 6 |
|
South Dakota |
2.3 | 6 |
|
Kansas |
2.4 | 8 |
|
Iowa |
2.5 | 9 |
|
Missouri |
2.5 | 9 |
|
Alabama |
2.6 | 11 |
|
Idaho |
2.6 | 11 |
|
Indiana |
2.6 | 11 |
|
Florida |
2.7 | 14 |
|
Montana |
2.7 | 14 |
|
Rhode Island |
2.7 | 14 |
|
Virginia |
2.7 | 14 |
|
Georgia |
2.8 | 18 |
|
Maine |
2.8 | 18 |
|
Oklahoma |
3.0 | 20 |
|
Wisconsin |
3.0 | 20 |
|
Wyoming |
3.0 | 20 |
|
South Carolina |
3.2 | 23 |
|
Arizona |
3.3 | 24 |
|
Arkansas |
3.3 | 24 |
|
Colorado |
3.3 | 24 |
|
Tennessee |
3.3 | 24 |
|
North Carolina |
3.4 | 28 |
|
Massachusetts |
3.5 | 29 |
|
Oregon |
3.5 | 29 |
|
Louisiana |
3.6 | 31 |
|
Mississippi |
3.6 | 31 |
|
Connecticut |
3.7 | 33 |
|
Kentucky |
3.7 | 33 |
|
New Jersey |
3.7 | 33 |
|
Washington |
3.7 | 33 |
|
West Virginia |
3.7 | 33 |
|
California |
3.9 | 38 |
|
Maryland |
3.9 | 38 |
|
Ohio |
3.9 | 38 |
|
Texas |
4.0 | 41 |
|
Hawaii |
4.1 | 42 |
|
Michigan |
4.2 | 43 |
|
Pennsylvania |
4.3 | 44 |
|
Delaware |
4.4 | 45 |
|
Illinois |
4.4 | 45 |
|
Nevada |
4.4 | 45 |
|
New York |
4.4 | 45 |
|
Alaska |
4.5 | 49 |
|
New Mexico |
4.5 | 49 |
|
District of Columbia |
5.2 | 51 |
|
Footnotes |
||
|
Note: Rates shown are a percentage of the labor force. Data refer to place of residence. Estimates for the current month are subject to revision the following month. |
||
Last Modified Date: August 19, 2022
8.19.2022. Montpelier www.labor.vermont.gov & www.bls.gov/web/laus/laumstrk.htm