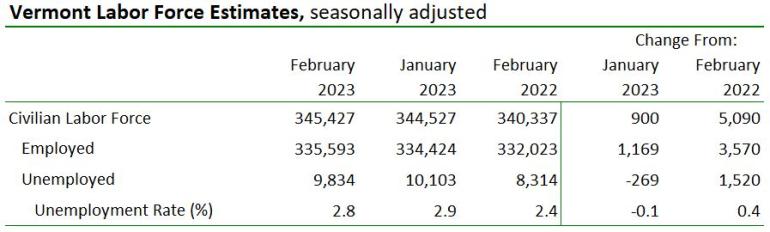
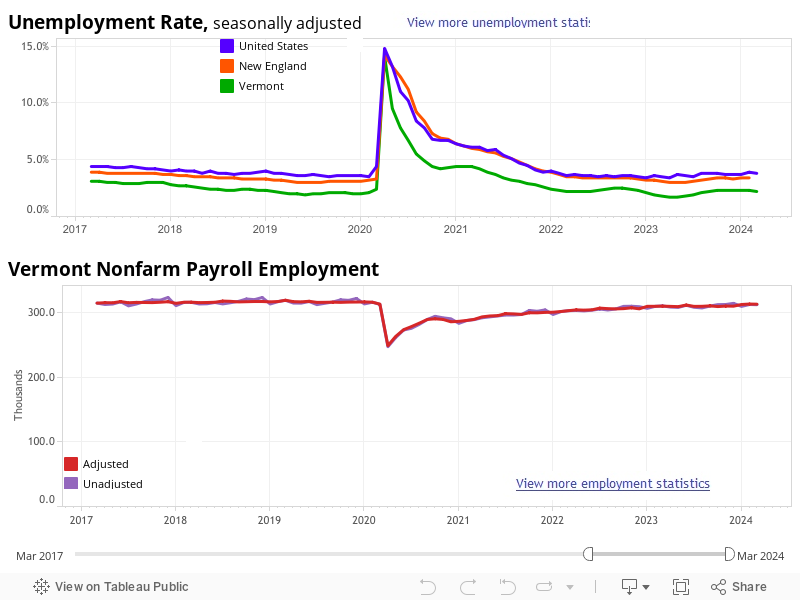
by Timothy McQuiston, Vermont Business Magazine Today, the Vermont Department of Labor reported the state's seasonally adjusted unemployment rate had fallen one-tenth to 2.8% in February 2023. The rate has fallen the last two months, after the annual revision reset the 2022 data upwards. The unemployment rate is statistical estimate based on household data. The revision in particular indicated more growth in the Labor Force than originally reported. The Labor Force is up 900 from January and up 5,090 from a year ago. The number of Employed also grew by 1,169 from January, while the number Unemployed fell by 269, indicating that all the major metrics showed improvement.
The changes to the unemployment rate and the number of employed persons were statistically significant in the seasonally adjusted series.
The civilian labor force participation rate was 63.6 percent in February, an increase of two-tenths of one percentage point from the prior month.
The comparable United States rate in February was 3.6 percent, an increase of two-tenths of one percentage point from the revised January estimate. Vermont is tied for the 12th lowest rate in the nation. North and South Dakota are tied for the lowest at 2.1% and Nevada has the highest at 5.5%.
Nationally, employment remains strong and a workforce remains tight, while inflation stays relatively high, despite a year-long series of rate hikes by the Federal Reserve Bank and another one-quarter point increase on Wednesday.
See further information and data tables below.
Vermont Labor Commissioner Michael Harrington said today: “February 2023 continues with stronger than previously expected growth in employment and labor force as seen in the revised 2022 data. This is welcome news and good timing as spring approaches and the Department ramps up career and educational awareness outreach with events and localized job fairs such as the event scheduled on March 29th in Brattleboro. Students and job seekers should be on the lookout for our upcoming spring job fair season. Employers and training providers that would like to join an in-person hiring event should reach out to the Department’s Workforce Development Division via their nearest field office. We encourage job seekers and businesses to visit our field offices or visit www.Labor.Vermont.gov/Jobs for more information about our upcoming events and services.”
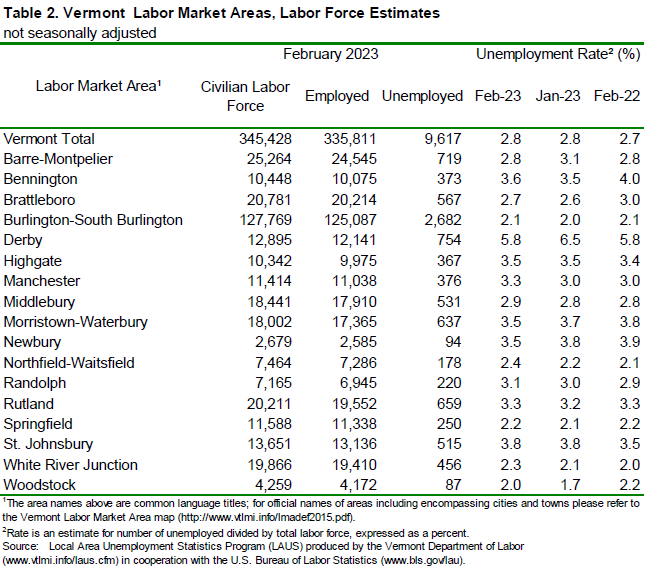
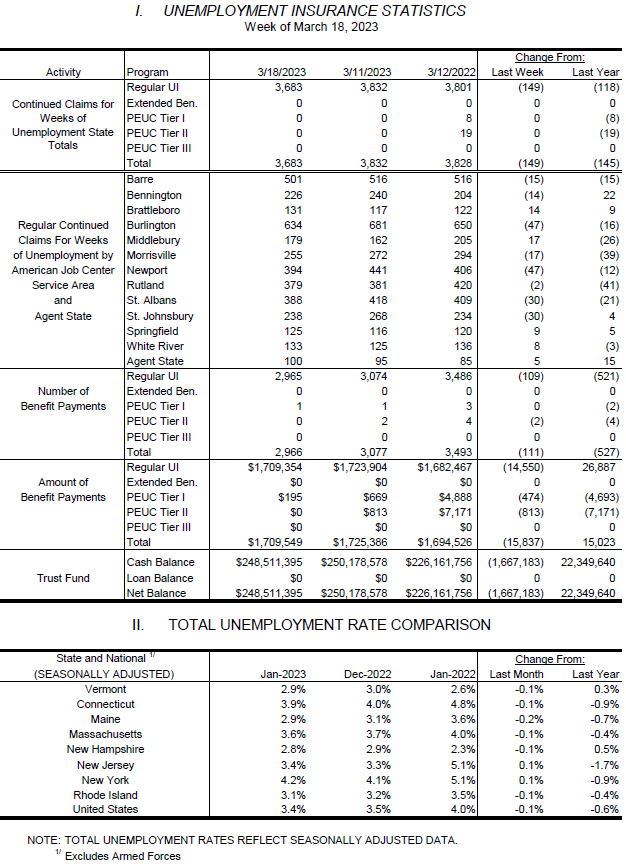
The February unemployment rates for Vermont’s 17 labor market areas ranged from 2.0 percent in Woodstock to 5.8 percent in Derby (note: local labor market area unemployment rates are not seasonally-adjusted – see Table 2). For comparison, the February unadjusted unemployment rate for Vermont was 2.8 percent, no change from the revised unadjusted January level and an increase of one-tenth of one percentage point from a year ago.
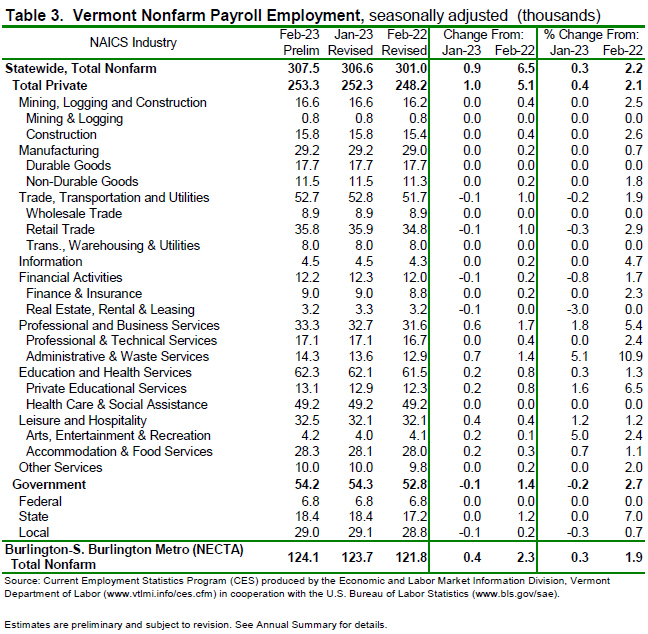
Seasonally Adjusted (Table 3)
The seasonally adjusted data for February reported an increase of 900 jobs from the revised January data. There was an increase of 300 jobs between the preliminary and the revised January estimates due to the inclusion of more data. The seasonally adjusted over-the-month changes in February were varied at the industry level. Those with a notable increase included: Administrative & Waste Services (+700 jobs or +5.1%), Arts, Entertainment & Recreation (+200 jobs or +5.0%) and Private Educational Services (+200 jobs or +1.6%). Industries with a notable decrease included: Real Estate, Rental & Leasing (-100 jobs or -3.0%) and Local Government (-100 jobs or -0.3%).
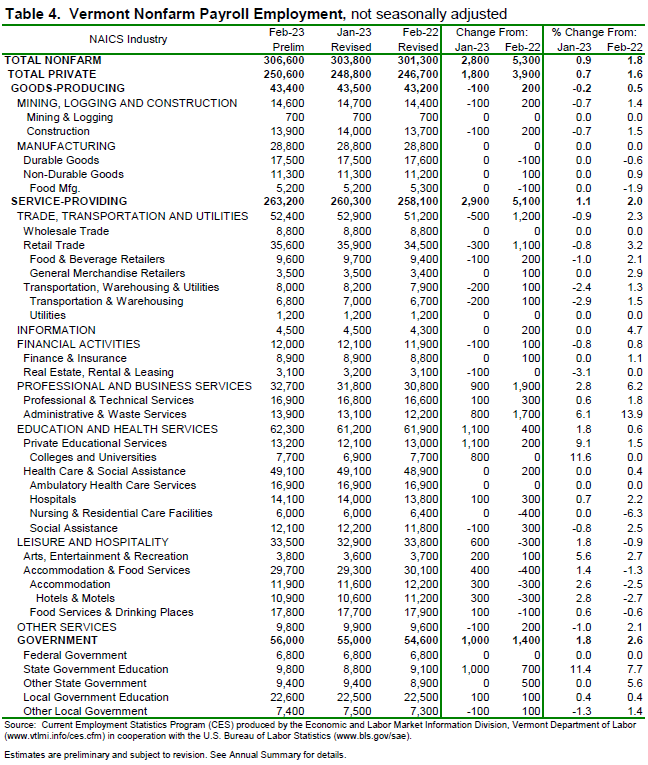
Not-Seasonally Adjusted (Table 4)
The preliminary ‘not-seasonally-adjusted’ jobs estimates for February showed an increase of 2,800 jobs when compared to the revised January numbers. As with the ‘seasonally adjusted’ data, this over-the-month change is from the revised January numbers which experienced an increase of 400 jobs from the preliminary estimates. The broader economic picture can be seen by focusing on the over-the-year changes in this data series. As detailed in the preliminary ‘not-seasonally-adjusted’ February data, Total Private industries increased by 3,900 jobs (+1.6%) over the year and Government (including public education) employment increased by 1,400 jobs (+2.6%) in the past year.
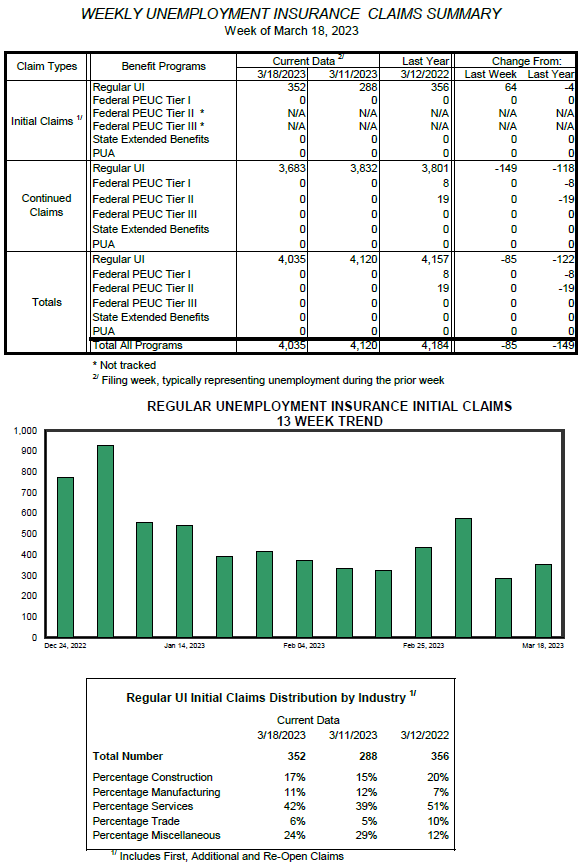
Weekly Unemployment Report
New unemployment claims in Vermont increased marginally by 64 last week, and are down 4 from a year ago to a total of 352 for the week of March 18. Unemployment claims remain relatively low. The state's Unemployment Insurance Trust Fund also remains strong and was well-funded throughout the pandemic despite a spike in unemployment claims. All of the pandemic-related claims have been resolved.
Meanwhile in national data, for the week ending March 18, the advance figure for seasonally adjusted initial claims in the US was 191,000, a decrease of 1,000 from the previous week's unrevised level of 192,000. The 4-week moving average was 196,250, a decrease of 250 from the previous week's unrevised average of 196,500. The US numbers have been generally falling since last August, again, despite the Fed hikes in interest rates intended to slow the economy and ultimately decrease inflation.
| State | February 2023(P) rate |
Rank |
|---|---|---|
|
North Dakota |
2.1 | 1 |
|
South Dakota |
2.1 | 1 |
|
Nebraska |
2.3 | 3 |
|
Montana |
2.4 | 4 |
|
Utah |
2.4 | 4 |
|
Alabama |
2.5 | 6 |
|
Florida |
2.6 | 7 |
|
Idaho |
2.6 | 7 |
|
Missouri |
2.6 | 7 |
|
New Hampshire |
2.7 | 10 |
|
Wisconsin |
2.7 | 10 |
|
Maine |
2.8 | 12 |
|
Vermont |
2.8 | 12 |
|
Colorado |
2.9 | 14 |
|
Iowa |
2.9 | 14 |
|
Kansas |
2.9 | 14 |
|
Maryland |
2.9 | 14 |
|
Minnesota |
3.0 | 18 |
|
Oklahoma |
3.0 | 18 |
|
Georgia |
3.1 | 20 |
|
Indiana |
3.1 | 20 |
|
Rhode Island |
3.1 | 20 |
|
Arkansas |
3.2 | 23 |
|
South Carolina |
3.2 | 23 |
|
Virginia |
3.2 | 23 |
|
New Jersey |
3.5 | 26 |
|
Tennessee |
3.5 | 26 |
|
Hawaii |
3.6 | 28 |
|
Louisiana |
3.6 | 28 |
|
New Mexico |
3.6 | 28 |
|
North Carolina |
3.6 | 28 |
|
Arizona |
3.7 | 32 |
|
Massachusetts |
3.7 | 32 |
|
Mississippi |
3.7 | 32 |
|
West Virginia |
3.7 | 32 |
|
Alaska |
3.8 | 36 |
|
Wyoming |
3.8 | 36 |
|
Kentucky |
3.9 | 38 |
|
Ohio |
3.9 | 38 |
|
Connecticut |
4.0 | 40 |
|
Texas |
4.0 | 40 |
|
New York |
4.2 | 42 |
|
California |
4.3 | 43 |
|
Michigan |
4.3 | 43 |
|
Pennsylvania |
4.4 | 45 |
|
Illinois |
4.5 | 46 |
|
Delaware |
4.6 | 47 |
|
Washington |
4.6 | 47 |
|
District of Columbia |
4.7 | 49 |
|
Oregon |
4.7 | 49 |
|
Nevada |
5.5 | 51 |
|
Footnotes |
||
|
Note: Rates shown are a percentage of the labor force. Data refer to place of residence. Estimates for the current month are subject to revision the following month. |
||
The Unemployment and Jobs Report for March is scheduled to be released on Friday, April 21st, 2023 at 10:00 a.m.
March 24, 2023. Montpelier, VT. www.vtlmi.info
![]()