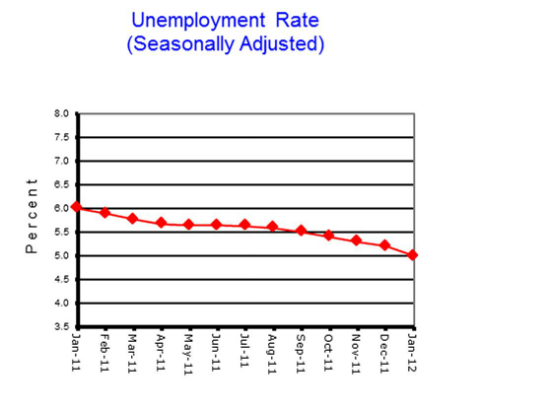
The Vermont Department of Labor announced today that the seasonally-adjusted statewide unemployment rate for May 2012 was 4.6 percent. The comparable national unemployment rate was 8.2 percent; an increase of one-tenth of a percent from the previous month. While the national number had an uptick, the Vermont data for May reflects no change from the prior monthâ s revised estimate of the statewide unemployment rate.
At this level, Vermontâ s seasonally-adjusted unemployment rate continues to rank as fourth lowest in the United States (North Dakota 3.0 percent, Nebraska 3.9 percent, South Dakota 4.3 Percent).
VermontLabor Force Statistics (Seasonally Adjusted)
Changes From
May
2012
April
2012
May
2011
April
2012
May
2011
Total Labor Force
357,900
358,700
358,300
-800
-400
Employment
341,500
342,200
338,100
-700
3,400
Unemployment
16,400
16,500
20,200
-100
-3,800
Rate (%)
4.6
4.6
5.6
0.0
-1.0
Vermontâ s labor force, employment and unemployment statistics are produced from a combination of a Statewide survey of households and statistical modeling.The data are produced by the Local Area Unemployment Statistics Program (LAUS) a cooperative program with the US Department of Labor, Bureau of Labor Statistics and the Vermont Department of Labor.
â The May jobs numbers confirmed the volatility seen in Aprilâ s data was related to seasonal fluctuations. As we move into the summer months and away from this period of transition, the data will produce clearer indications about the economic direction of the state. In the interim, it was encouraging to see a broad advancement in jobs across industries with notably concentrations of job increases in Manufacturing and Leisure & Hospitality,’said Department of Labor Commissioner Annie Noonan.
â The Vermont Department of Labor continues to actively monitor the data on the labor market and will be reaching out to employers to discuss their hiring needs. It is clear that the effects of the recent recession have influenced Vermonters’decisions with regards to work ‘whether it be changes to retirement plans, furthering education and training or even ceasing to continue work searches. As a Department, it is our priority to improve labor market outcomes and assist individuals who want work. Job-seekers and employers alike are encouraged to contact their local Career Resources Centers to learn about the services we offer,’added Commissioner Noonan.
State of Vermont Overview
The Vermont seasonally adjusted unemployment rate was unchanged in May; holding steady at 4.6 percent. The comparable rate for the United States experienced an increase of one-tenth of a percent rising to the level of 8.2 percent. The seasonally adjusted Vermont data show the Vermont total labor force decreased by 800. Total employment decreased by 700 while total unemployment decreased by 100. May posted the third straight month of declines to the total labor force.
May unemployment rates for Vermontâ s 17 labor market areas ranged from 2.8 percent in Hartford to 6.5 percent in Newport (note: local labor market area unemployment rates are not seasonally adjusted). For comparison, the May unadjusted unemployment rate for Vermont was 4.4 percent which reflects a decrease of six-tenths of a percent from the April level and a decline of 1.0 percent from a year ago.
Analysis of Job Changes by Industry
The preliminary â not-seasonally-adjusted’jobs estimates for May show an increase of 5,000 jobs when compared to the revised April numbers. This reported over-the-month change does not include the 150 job decrease between the preliminary and the revised April estimates due to the inclusion of more data. The broader economic trends can be detected by focusing on the changes between May 2012 and May 2011. As detailed in the preliminary â not seasonally adjusted’May data, Total Private Industries have increased by 2.0 percent (4,800 jobs) while Government has lost employment (-1,050 jobs or -1.9 percent) within the last year.
The seasonally adjusted data for May reports an increase of 3,300 jobs from the revised April data. As with the â not-seasonally-adjusted’data, this over-the-month change is from the revised April numbers which experienced a downward revision from the preliminary estimates by 200 jobs. A review of the seasonally adjusted over-the-month changes in May reflects employment increases across ownership types; Private Industries and Total Government both reported job gains (2,600 and 700 jobs, respectively). Leisure & Hospitality had the largest movement at the sector level with a reported job increase of 1,700 jobs (5.5%) from the previously reported April data. Manufacturing also reported job gains from the prior month (+500 jobs or 1.6%). Conversely, the â not-seasonally-adjusted’Construction data did not keep up with historic hiring trends in May putting the seasonally adjusted estimate down for the month (-500 jobs or -3.5%).
Vermont Seasonally Adjusted Nonfarm Employment in Thousands
BY NAICS
Prelim.
Revised
Revised
Change From:
% Change From:
May-12
Apr-12
May-11
Apr-12
May-11
Apr-12
May-11
Total - Nonfarm
303.5
300.2
299.0
3.3
4.5
1.1
1.5
Private Industries
250.8
248.2
245.2
2.6
5.6
1.0
2.3
Construction
13.8
14.3
13.5
-0.5
0.3
-3.5
2.2
Manufacturing
31.4
30.9
30.9
0.5
0.5
1.6
1.6
Durable Goods
22.3
21.9
21.6
0.4
0.7
1.8
3.2
Non-Durable Goods
9.1
9.0
9.3
0.1
-0.2
1.1
-2.2
Trade, Transportation & Utilities
57.4
56.9
56.2
0.5
1.2
0.9
2.1
Wholesale Trade
9.7
9.6
9.5
0.1
0.2
1.0
2.1
Retail Trade
39.3
38.8
37.9
0.5
1.4
1.3
3.7
Trans., Warehousing & Utilities
8.4
8.5
8.8
-0.1
-0.4
-1.2
-4.5
Financial Activities
12.0
12.0
12.1
0.0
-0.1
0.0
-0.8
Finance & Insurance
9.1
9.1
9.2
0.0
-0.1
0.0
-1.1
Real Estate, Rental & Leasing
2.9
2.9
2.9
0.0
0.0
0.0
0.0
Professional & Business Services
26.9
26.7
24.5
0.2
2.4
0.7
9.8
Professional., Scientific & Technical
15.0
14.5
13.6
0.5
1.4
3.4
10.3
Administrative Support & Waste
10.4
10.5
9.5
-0.1
0.9
-1.0
9.5
Education & Health Services
60.9
60.8
59.7
0.1
1.2
0.2
2.0
Private Ed. Services
13.1
13.2
12.7
-0.1
0.4
-0.8
3.1
Health Care & Social Assistance
47.8
47.6
47.0
0.2
0.8
0.4
1.7
Leisure & Hospitality
32.8
31.1
32.7
1.7
0.1
5.5
0.3
Arts, Entertainment & Recreation
3.7
3.8
3.9
-0.1
-0.2
-2.6
-5.1
Accommodation & Food Services
29.1
27.3
28.8
1.8
0.3
6.6
1.0
Other Services
9.9
9.8
9.9
0.1
0.0
1.0
0.0
Total Government
52.7
52.0
53.8
0.7
-1.1
1.3
-2.0
State Government
18.3
17.6
18.0
0.7
0.3
4.0
1.7
Local Government
28.4
28.5
29.7
-0.1
-1.3
-0.4
-4.4
Burlington-S. Burlington MSA
Total - Nonfarm
116.3
115.1
113.1
1.2
3.2
1.0
2.8
Notes: Statewide Total Nonfarm is a summed total. Finance & Insurance and Real Estate, Rental & Leasing have been added as a seasonally adjusted series in 2012.
Mining & Logging and Information are not published seasonally adjusted because the seasonal component, which is small relative to the trend-cycle and irregular components, cannot be separated with sufficient precision.
Program Update: Starting with the March 2011 numbers, the Current Employment Statistics (CES) estimates transitioned from the VT Department of Labor to the U.S. Bureau of Labor Statistics (BLS). The BLS implemented several methodological changes to standardize the estimation approach across states. While these changes will reduce the potential for statistical bias in state and metropolitan area estimates, they may increase the month to month variability of the estimates. More information is available on the BLS website at http://www.bls.gov/sae/cesprocs.htm.
Current Employment Statistics Program (CES). Produced by the Vermont Department of Labor in cooperation with the U.S Bureau of Labor Statistics.