Vermont home prices fell 4.8 percent over the last year, according to a national rating service. This put Vermont eighth worst, one spot ahead of seventh worst New Hampshire in prices for single-family homes. CoreLogic (NYSE: CLGX), a leading provider of information, analytics and business services, today released its March Home Price Index (HPI) report which shows that nationally home prices, including distressed sales, declined on a year-over-year basis by 0.6 percent inMarch 2012compared toMarch 2011. On a month-over-month basis, home prices, including distressed sales, increased by 0.6 percent inMarch 2012compared toFebruary 2012, the first month-over-month increase sinceJuly 2011.
Excluding distressed sales, month-over-month prices increased for the third month in a row. The CoreLogic HPI also shows that year-over-year prices, excluding distressed sales, rose by 0.9 percent inMarch 2012compared toMarch 2011. Distressed sales include short sales and real estate owned (REO) transactions.
"This spring the housing market is responding to an improving balance between real estate supply and demand which is causing stabilization in house prices," saidMark Fleming, chief economist for CoreLogic. "Although this has been the case in each of the last two years, the difference this year is that stabilization is occurring without the support of tax credits and in spite of a declining share of REO sales."
"While housing prices remain flat nationally, in many markets tighter inventories are beginning to lift home prices," saidAnand Nallathambi, president and chief executive officer of CoreLogic. "This is true inPhoenix, New YorkandWashington, for example, which all reflect higher home price values than a year ago. A continuation of this trend will be good for our industry across U.S. markets."
Highlights as ofMarch 2012
Including distressed sales, the five states with the highestappreciationwere:Wyoming(+5.9 percent),West Virginia(+5.3 percent),Arizona(+5.1 percent),North Dakota(+4.7 percent) andFlorida(+4.5 percent).
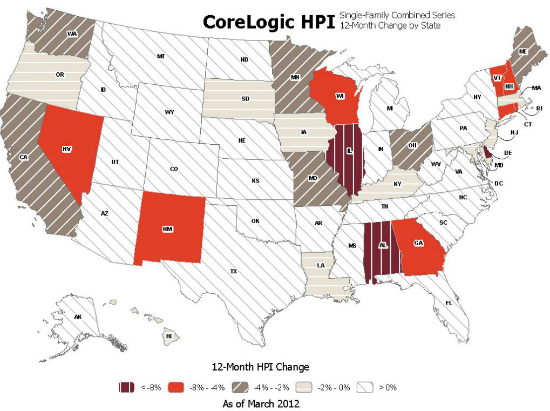
Including distressed sales, the five states with the greatestdepreciationwere:Delaware(-10.6 percent),Illinois(-8.3 percent),Alabama(-8.0 percent),Georgia(-7.3 percent) andNevada(-5.8 percent).
Excluding distressed sales, the five states with the highestappreciationwere:Idaho(+5.4 percent),North Dakota(+5.1 percent),South Carolina(+4.7 percent),Montana(+3.5 percent) andKansas(+3.4 percent).
Excluding distressed sales, the five states with the greatestdepreciationwere:Delaware(-7.6 percent),Alabama(-4.1 percent),Nevada(-3.9 percent),Vermont(-3.9 percent) andRhode Island(-2.9 percent).
Including distressed transactions, the peak-to-current change in the national HPI (fromApril 2006toMarch 2012) was -33.7 percent. Excluding distressed transactions, the peak-to-current change in the HPI for the same period was -24.5 percent.
The five states with the largest peak-to-current declines including distressed transactions areNevada(-59.9 percent),Arizona(-48.6 percent),Florida(-48.1 percent),Michigan(-45.1 percent) andCalifornia(-42.7 percent).
Of the top 100 Core Based Statistical Areas (CBSAs) measured by population, 57 are showing year-over-year declines in March, eight fewer than in February.
*February data was revised. Revisions with public records data are standard, and to ensure accuracy, CoreLogic incorporates the newly released public data to provide updated results.
March HPI for the Country's Largest CBSAs by Population:
March 2012 12-Month HPI
CBSA
Change by CBSA
Single-Family
Single-Family Excluding Distressed
Chicago-Joliet-Naperville, IL
-8.8%
-2.7%
Atlanta-Sandy Springs-Marietta, GA
-8.1%
-2.1%
Riverside-San Bernardino-Ontario, CA
-3.2%
-1.2%
Los Angeles-Long Beach-Glendale, CA
-2.4%
0.6%
Houston-Sugar Land-Baytown, TX
0.5%
4.1%
Washington-Arlington-Alexandria, DC-VA-MD-WV
0.7%
1.8%
Philadelphia, PA
0.7%
1.8%
Dallas-Plano-Irving, TX
1.1%
4.0%
New York-White Plains-Wayne, NY-NJ
2.0%
2.9%
Phoenix-Mesa-Glendale, AZ
7.7%
4.0%
Source: CoreLogic.
MarchStateand National Ranking Based on HPI Including Distressed:
March 2012 12-Month HPI
State
Change by State
Single-Family
Single-Family
Excluding Distressed
National
-0.6%
0.9%
Delaware
-10.6%
-7.6%
Illinois
-8.3%
-2.6%
Alabama
-8.0%
-4.1%
Georgia
-7.3%
-2.4%
Nevada
-5.8%
-3.9%
Connecticut
-5.6%
-2.7%
New Hampshire
-4.9%
-2.1%
Vermont
-4.8%
-3.9%
Rhode Island
-4.3%
-2.9%
Wisconsin
-4.2%
-1.1%
New Mexico
-4.0%
-1.5%
Ohio
-3.3%
0.5%
Missouri
-2.9%
1.8%
Minnesota
-2.5%
-0.1%
Maine
-2.5%
2.8%
Washington
-2.3%
2.1%
California
-2.0%
1.2%
Massachusetts
-1.6%
2.0%
New Jersey
-1.5%
-1.6%
Oregon
-1.2%
-0.1%
Louisiana
-1.2%
1.1%
Kentucky
-0.6%
-1.0%
Iowa
-0.6%
-0.2%
South Dakota
-0.5%
3.2%
Hawaii
-0.1%
-0.9%
Maryland
-0.1%
0.0%
North Carolina
0.2%
1.2%
Oklahoma
0.5%
0.1%
Tennessee
0.5%
1.8%
Indiana
0.6%
1.2%
Pennsylvania
0.9%
1.7%
Texas
0.9%
3.2%
Virginia
1.2%
2.4%
Nebraska
1.4%
0.0%
Arkansas
1.7%
0.6%
Alaska
1.7%
3.2%
Kansas
1.8%
3.4%
Utah
2.3%
3.4%
Michigan
2.4%
-1.6%
New York
2.5%
2.4%
South Carolina
2.7%
4.7%
District of Columbia
2.8%
1.5%
Montana
2.8%
3.5%
Colorado
3.0%
2.9%
Mississippi
3.7%
3.3%
Idaho
4.3%
5.4%
Florida
4.5%
2.8%
North Dakota
4.7%
5.1%
Arizona
5.1%
1.4%
West Virginia
5.3%
0.3%
Wyoming
5.9%
2.8%
Source: CoreLogic.
Figure 1: Home Price Index Featuring March Data, Percentage Change Year-Over-Year
Map 1: Single-Family Combined Series, 12-Month Change by State
Map 2: Single-Family Combined Excluding Distressed Series, 12-Month Change by State
Methodology
The CoreLogic HPI incorporates more than 30 years' worth of repeat sales transactions, representing more than 65 million observations sourced from CoreLogic industry-leading property information and its securities and servicing databases. The CoreLogic HPI provides a multi-tier market evaluation based on price, time between sales, property type, loan type (conforming vs. nonconforming) and distressed sales. The CoreLogic HPI is a repeat-sales index that tracks increases and decreases in sales prices for the same homes over time, including single-familyattachedand single-familydetachedhomes, which provides a more accurate "constant-quality" view of pricing trends than basing analysis on all home sales. The CoreLogic HPI provides the most comprehensive set of monthly home price indices and median sales prices available covering 6,688 ZIP codes (58 percent of total U.S. population), 617 Core Based Statistical Areas (86 percent of total U.S. population) and 1,166 counties (84 percent of total U.S. population) located in all 50 states and the District of Columbia.
About CoreLogic
CoreLogic (NYSE: CLGX) is a leading provider of consumer, financial and property information, analytics and services to business and government. The Company combines public, contributory and proprietary data to develop predictive decision analytics and provide business services that bring dynamic insight and transparency to the markets it serves. CoreLogic has built one of the largest and most comprehensive U.S. real estate, mortgage application, fraud, and loan performance databases and is a recognized leading provider of mortgage and automotive credit reporting, property tax, valuation, flood determination, and geospatial analytics and services. More than one million users rely on CoreLogic to assess risk, support underwriting, investment and marketing decisions, prevent fraud, and improve business performance in their daily operations. The Company, headquartered inSanta Ana, Calif., has approximately 5,000 employees globally. For more information visitwww.corelogic.com.
Source: CoreLogic SANTA ANA, Calif.,May 8, 2012/PRNewswire