CoreLogic (NYSE: CLGX), a leading provider of information, analytics and business services, today released its February Home Price Index (HPI)report, the most current and comprehensive source of home prices available today. Vermont is in the top five states with the greatest depreciation, excluding distressed sales, with -4 percent.
Overall, excluding distressed sales, month-over-month prices increased 0.7 percent in February from January. The CoreLogic HPIalso showed that year-over-year prices declined by 0.8 percent inFebruary 2012compared toFebruary 2011. Distressed sales include short sales and real estate owned (REO) transactions.
The report also shows national home prices, including distressed sales, declined on a year-over-year basis by 2.0 percent inFebruary 2012and by 0.8 percent compared toJanuary 2012, the seventh consecutive monthly decline.
"House prices, based on data through February, continue to decline, but at a decreasing rate. The deceleration in the pace of decline is a first step toward ultimately growing again," saidMark Fleming, chief economist for CoreLogic."Excluding distressed sales, we already see modest price appreciation month over month in January and February."
"The continued strength of sales activity and tightening inventories in many markets are early and hopeful signs that prices will continue to stabilize and improve in the coming months. In fact, non-distressed home sale prices, which represent two-thirds of all sales, have appreciated by just over 1.0 percent since the beginning of the year," saidAnand Nallathambi, president and CEO of CoreLogic.
Highlights as ofFebruary 2012
Including distressed sales, the five states with the highestappreciationwere:West Virginia(+8.6 percent),Michigan(+5.8 percent),Florida(+4.7 percent),Arizona(+4.5 percent) andSouth Dakota(+4.1 percent).
Including distressed sales, the five states with the greatestdepreciationwere:Delaware(-11.2 percent),Connecticut(-7.9 percent),Rhode Island(-7.8 percent),Illinois(-7.1 percent) andGeorgia(-6.6 percent).
Excluding distressed sales, the five states with the highestappreciationwere:South Dakota(+5.9 percent),West Virginia(+5.6 percent),Maine(+4.5 percent),Utah(+3.7 percent) andMontana(+3.6 percent).
Excluding distressed sales, the five states with the greatestdepreciationwere:Delaware(-8.7 percent),Connecticut(-4.9 percent),Nevada(-4.6 percent),Vermont(-4.0 percent) andMinnesota(-3.3 percent).
Including distressed transactions, the peak-to-current change in the national HPI (fromApril 2006toFebruary 2012) was -34.4 percent. Excluding distressed transactions, the peak-to-current change in the HPI for the same period was -24.6 percent.
The five states with the largest peak-to-current declines including distressed transactions areNevada(-60.2 percent),Arizona(-49.8 percent),Florida(-48.6 percent),Michigan(-44.0 percent) andCalifornia(-43.7 percent).
Of the top 100 Core Based Statistical Areas (CBSAs) measured by population, 67 are showing year-over-year declines in February, nine fewer than in January.
*January data was revised. Revisions with public records data are standard, and to ensure accuracy, CoreLogic incorporates the newly released public data to provide updated results.
February HPI for the Country's Largest CBSAs by Population:
February 2012 12-Month HPI
CBSA
Change by CBSA
Single-Family
Single-Family
Excluding
Distressed
Chicago-Joliet-Naperville, IL
-7.3%
-3.8%
Atlanta-Sandy Springs-Marietta, GA
-6.5%
-2.5%
Los Angeles-Long Beach-Glendale, CA
-4.4%
0.2%
Riverside-San Bernardino-Ontario, CA
-3.2%
-0.9%
Philadelphia, PA
-2.4%
-1.1%
Washington-Arlington-Alexandria, DC-VA-MD-WV
0.2%
2.1%
New York-White Plains-Wayne, NY-NJ
0.3%
1.0%
Houston-Sugar Land-Baytown, TX
0.6%
2.9%
Dallas-Plano-Irving, TX
1.9%
1.2%
Phoenix-Mesa-Glendale, AZ
7.0%
3.9%
Source: CoreLogic.
February State and National Ranking Based on HPI Including Distressed:
February 2012 12-Month HPI
State
Change by State
Single-Family
Single-Family
Excluding
Distressed
National
-2.0%
-0.8%
Delaware
-11.2%
-8.7%
Connecticut
-7.9%
-4.9%
Rhode Island
-7.8%
-2.0%
Illinois
-7.1%
-3.2%
Georgia
-6.6%
-3.0%
Alabama
-6.2%
-2.6%
Nevada
-6.1%
-4.6%
Washington
-4.6%
-1.5%
Vermont
-4.0%
-4.0%
Massachusetts
-3.6%
0.3%
California
-3.4%
0.1%
Ohio
-3.3%
-1.2%
Louisiana
-3.2%
2.0%
New Jersey
-2.9%
-2.5%
Minnesota
-2.7%
-3.3%
Wisconsin
-2.7%
-1.3%
New Mexico
-2.1%
-2.1%
Pennsylvania
-2.1%
-1.5%
Oregon
-2.0%
-1.7%
New Hampshire
-2.0%
2.0%
Maryland
-1.9%
-1.5%
Missouri
-1.8%
-0.3%
Iowa
-1.4%
-1.0%
Tennessee
-1.3%
-0.5%
Hawaii
-0.8%
-3.2%
Kentucky
-0.6%
-0.2%
Oklahoma
-0.6%
0.2%
Arkansas
-0.4%
-1.4%
New York
-0.4%
-0.4%
North Carolina
-0.3%
0.6%
Virginia
0.0%
1.6%
Texas
0.4%
1.5%
Wyoming
0.7%
1.0%
Montana
0.8%
3.6%
Colorado
0.9%
2.1%
Alaska
1.1%
3.1%
Mississippi
1.3%
1.7%
Indiana
1.4%
3.2%
Kansas
1.6%
1.6%
Nebraska
2.0%
0.4%
North Dakota
2.2%
3.4%
Utah
2.4%
3.7%
South Carolina
2.5%
2.1%
Idaho
3.5%
2.6%
Maine
3.7%
4.5%
District of Columbia
4.1%
1.8%
South Dakota
4.1%
5.9%
Arizona
4.5%
1.6%
Florida
4.7%
1.6%
Michigan
5.8%
1.3%
West Virginia
8.6%
5.6%
Source: CoreLogic.
Figure 1 -Home Price Index
Percentage Change Year-Over-Year
Figure 2 -CoreLogic HPI Single-Family Combined Series
12-Month Change by State
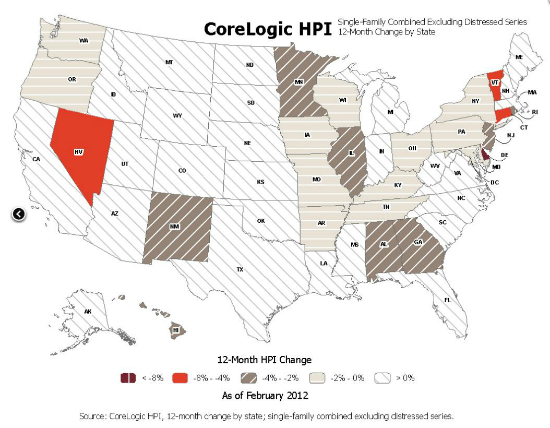
Figure 3 -CoreLogic HPI Single-Family Combined Excluding Distressed Series
12-Month Change by State
Methodology
The CoreLogic HPI incorporates more than 30 years' worth of repeat sales transactions, representing more than 65 million observations sourced from CoreLogic industry-leading property information and its securities and servicing databases. The CoreLogic HPI provides a multi-tier market evaluation based on price, time between sales, property type, loan type (conforming vs. nonconforming), and distressed sales. The CoreLogic HPI is a repeat-sales index that tracks increases and decreases in sales prices for the same homes over time, including single-familyattachedand single-familydetachedhomes, which provides a more accurate "constant-quality" view of pricing trends than basing analysis on all home sales. The CoreLogic HPI provides the most comprehensive set of monthly home price indices and median sales prices available covering 6,669 ZIP codes (58 percent of total U.S. population), 618 Core Based Statistical Areas (86 percent of total U.S. population) and 1,163 counties (84 percent of total U.S. population) located in all 50 states and the District of Columbia.
About CoreLogic
CoreLogic (NYSE: CLGX) is a leading provider of consumer, financial and property information, analytics and services to business and government. The Company combines public, contributory and proprietary data to develop predictive decision analytics and provide business services that bring dynamic insight and transparency to the markets it serves. CoreLogic has built one of the largest and most comprehensive U.S. real estate, mortgage application, fraud, and loan performance databases and is a recognized leading provider of mortgage and automotive credit reporting, property tax, valuation, flood determination, and geospatial analytics and services. More than one million users rely on CoreLogic to assess risk, support underwriting, investment and marketing decisions, prevent fraud, and improve business performance in their daily operations. The Company, headquartered inSanta Ana, Calif., has more than 5,000 employees globally. For more information visitwww.corelogic.com.
Source: CoreLogic
The data provided is for use only by the primary recipient or the primary recipient's publication or broadcast. This data may not be re-sold, republished or licensed to any other source, including publications and sources owned by the primary recipient's parent company without prior written permission from CoreLogic. Any CoreLogic data used for publication or broadcast, in whole or in part, must be sourced as coming from CoreLogic, a data and analytics company. For use with broadcast or web content, the citation must directly accompany first reference of the data. If the data is illustrated with maps, charts, graphs or other visual elements, the CoreLogic logo must be included on screen or web site. For questions, analysis or interpretation of the data, contactLori Guytonat[email protected]orBill Campbellat[email protected]. Data provided may not be modified without the prior written permission of CoreLogic.Do not use the data in any unlawful manner. This data is compiled from public records, contributory databases and proprietary analytics, and its accuracy is dependent upon these sources.
CoreLogic. 4.4.2012