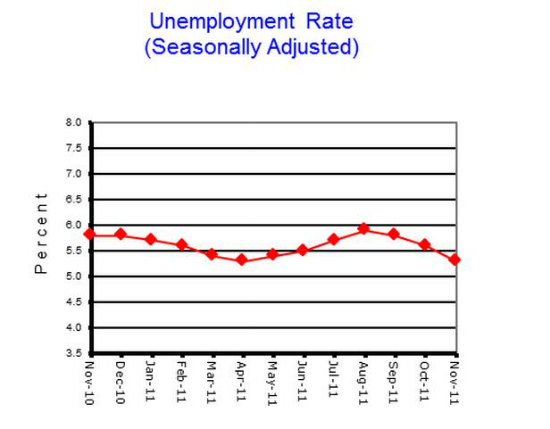
The Vermont Department of Labor announced today that the seasonally-adjusted statewide unemployment rate for December 2011 was 5.1 percent, a decrease of two-tenths of a percent from the November rate. At 5.1 percent, Vermont’s seasonally adjusted unemployment rate is the lowest the statewide average has recorded since October 2008. The current comparable national rate is 8.5 percent which reflects a decrease of two-tenths of a percent from the previous month post revision.
Vermont Labor Force Statistics (Seasonally Adjusted)
Changes From
December
2011
November
2011
December
2010
November
2011
December
2010
Total Labor Force
362,100
363,200
361,200
-1,100
900
Employment
343,800
344,200
340,200
-400
3,600
Unemployment
18,300
19,100
21,000
-800
-2,700
Rate (%)
5.1
5.3
5.8
-0.2
-0.7
Vermont’s labor force, employment and unemployment statistics are produced from a combination of a Statewide survey of households and statistical modeling. The data are produced by the Local Area Unemployment Statistics Program (LAUS) a cooperative program with the US Department of Labor, Bureau of Labor Statistics and the Vermont Department of Labor.
Vermont’s annualized average unemployment rate for 2011 was 5.5 percent, barring revision, a decline of seven-tenths from the 2010 annual average.
‘The trend in 2011 created some welcomed distance from the recent recession. Economic indicators in Vermont, such as the unemployment rate and employment by industry, are more positive. We are still paying close attention to federal and international economic risks as areas for potential risk, but Vermont appears to be making headway forward in its economic recovery. We hope that Vermont employers will continue to work with the department for recruitment needs since there are many Vermonters who sincerely want to work and need a chance at a job to prove themselves’, said Department of Labor Commissioner Annie Noonan. The Department of Labor administers many programs and incentives that can help both employers and job seekers, such as job development, placement assistance, applicant screening, on the job training funds, apprenticeship and internship programs, veterans and long-term unemployed hiring incentives, workforce education and training grants, and specialized programs for groups such as ‘at-risk’ youth, dislocated workers, unemployed and transitioning workers, and Vermont veterans. ‘There are many program supports available to Vermonters, and the best way to find out about the programs and services is to visit one of our 12 regional VDOL offices’.
State of Vermont Overview
The Vermont seasonally adjusted unemployment rate decreased by two-tenths of a percent in December to 5.1 percent. The comparable rate over the same time period for the United States was 8.5 percent, a decrease of two-tenths of a percent from the prior month. The seasonally adjusted Vermont data show the total Vermont labor force declined by 1,100. Total employment decreased by 400 while total unemployment decreased by 800. The over the month changes to the unemployment rate and total unemployment were statistically significant. Vermont is reporting the lowest number of total unemployment since October 2008.
December unemployment rates for Vermont’s 17 labor market areas ranged from 3.2 percent in Warren-Waitsfield to 7.7 percent in Newport (note: local labor market area unemployment rates are not seasonally adjusted). For comparison, the December unadjusted unemployment rate for Vermont was 4.9 percent which reflects an increase of two-tenths of a percent from the November level and a decline of six-tenths of a percent from a year ago.
Analysis of Job Changes by Industry
The preliminary ‘not seasonally adjusted’ jobs numbers for December show an increase of 4,300 jobs when compared to the revised November numbers. This reported over the month change does not include the 150 job increase between the preliminary and the revised November estimates due to the inclusion of more data. As detailed in the preliminary ‘not seasonally adjusted’ December data, Total Private was up 5,050 jobs and Government reported a decrease of 750 jobs. Leisure and Hospitality recorded a positive bounce of 5,550 jobs as winter attractions ramped up activities. The next largest positive nominal change was in Trade, Transportation & Utilities (+900 jobs). Conversely, sectors reporting the greatest nominal job losses were Construction (-850 jobs) and Local Government Education (-750 jobs).
The seasonally adjusted data for December reports a decrease of 700 jobs from the revised November data. As with the ‘not seasonally adjusted’ data, this over the month change is from the revised November numbers which experienced an upward revision from the preliminary estimates by 400 jobs. A review of the seasonally adjusted December numbers reflects that Vermont’s Private Industries reported a decrease of 500 jobs while Total Government reported a decrease of 200 jobs. Significant over the month nominal changes were noticed in several industries. At the sector level, the largest nominal job gains occurred in Construction (600 jobs) and Trade, Transportation & Utilities (500 jobs). For job declines, Leisure & Hospitality (-700 jobs) and Local Government (-600 jobs) reported the largest nominal movements.
ESTIMATED NONFARM EMPLOYMENT IN VERMONT
(Not Seasonally Adjusted)
Prelim
Revised
Revised
Changes From:
% Changes From:
INDUSTRY BY NAICS
Dec-11
Nov-11
Dec-10
Nov-11
Dec-10
Nov-11
Dec-10
TOTAL NONFARM
310,750
306,450
306,250
4,300
4,500
1.4%
1.5%
TOTAL PRIVATE
254,550
249,500
249,800
5,050
4,750
2.0%
1.9%
GOODS PRODUCING
45,750
46,500
45,350
-750
400
-1.6%
0.9%
MANUFACTURING
32,000
31,850
32,000
150
0
0.5%
0.0%
Durable Goods
23,200
23,000
22,850
200
350
0.9%
1.5%
Computer & Electrical Equipment Mfg.
8,050
8,050
8,150
0
-100
0.0%
-1.2%
Fabricated Metal Products Mfg.
2,400
2,400
2,400
0
0
0.0%
0.0%
Non-Durable Goods
8,800
8,850
9,150
-50
-350
-0.6%
-3.8%
Food Mfg.
4,400
4,400
4,250
0
150
0.0%
3.5%
CONSTRUCTION
13,050
13,900
12,600
-850
450
-6.1%
3.6%
MINING & LOGGING
700
750
750
-50
-50
-6.7%
-6.7%
SERVICE-PROVIDING
265,000
259,950
260,900
5,050
4,100
1.9%
1.6%
TRADE, TRANSPORTATION AND UTILITIES
59,200
58,300
57,550
900
1,650
1.5%
2.9%
Wholesale Trade
9,950
9,950
9,300
0
650
0.0%
7.0%
Retail Trade
40,000
39,250
39,250
750
750
1.9%
1.9%
Food & Beverage Stores
9,850
9,700
9,950
150
-100
1.5%
-1.0%
General Merchandise Store
3,150
3,100
3,050
50
100
1.6%
3.3%
Transportation, Warehousing and Utilities
9,250
9,100
9,000
150
250
1.6%
2.8%
Utilities
1,800
1,800
1,750
0
50
0.0%
2.9%
Transportation & Warehousing
7,450
7,300
7,250
150
200
2.1%
2.8%
INFORMATION
5,050
5,050
5,250
0
-200
0.0%
-3.8%
FINANCIAL ACTIVITIES
12,150
12,150
12,500
0
-350
0.0%
-2.8%
Finance & Insurance
9,250
9,250
9,400
0
-150
0.0%
-1.6%
Real Estate, Rental & Leasing
2,900
2,900
3,100
0
-200
0.0%
-6.5%
PROFESSIONAL AND BUSINESS SERVICES
25,550
25,850
23,500
-300
2,050
-1.2%
8.7%
Professional, Scientific and Technical
16,000
15,950
14,150
50
1,850
0.3%
13.1%
Administrative, Support and Waste
9,100
9,650
9,050
-550
50
-5.7%
0.6%
EDUCATIONAL AND HEALTH SERVICES
60,850
61,150
60,100
-300
750
-0.5%
1.2%
Educational Services
12,650
12,900
13,050
-250
-400
-1.9%
-3.1%
College, Universities and Professional
7,200
7,550
7,400
-350
-200
-4.6%
-2.7%
Health Care and Social Assistance
48,200
48,250
47,050
-50
1,150
-0.1%
2.4%
Ambulatory Health Care Services
16,000
16,050
15,700
-50
300
-0.3%
1.9%
Hospitals
12,900
12,900
12,550
0
350
0.0%
2.8%
Nursing and Residential Care Facilities
7,250
7,300
7,150
-50
100
-0.7%
1.4%
LEISURE AND HOSPITALITY
36,100
30,550
35,600
5,550
500
18.2%
1.4%
Arts, Entertainment and Recreation
3,250
3,100
3,400
150
-150
4.8%
-4.4%
Accommodation and Food Services
32,850
27,450
32,200
5,400
650
19.7%
2.0%
Accommodations
13,900
9,050
14,000
4,850
-100
53.6%
-0.7%
Hotels & Motels
11,950
7,650
12,950
4,300
-1,000
56.2%
-7.7%
Food Services and Drinking Places
18,950
18,400
18,200
550
750
3.0%
4.1%
OTHER SERVICES
9,900
9,950
9,950
-50
-50
-0.5%
-0.5%
GOVERNMENT
56,200
56,950
56,450
-750
-250
-1.3%
-0.4%
Federal Government
6,550
6,500
6,450
50
100
0.8%
1.6%
State Government Education
10,350
10,400
9,300
-50
1,050
-0.5%
11.3%
Local Government Education
22,950
23,700
25,000
-750
-2,050
-3.2%
-8.2%
Other State Government
8,850
8,900
8,600
-50
250
-0.6%
2.9%
Other Local Government
7,500
7,450
7,100
50
400
0.7%
5.6%
Note: CES PROGRAM DATA ARE PRDUCED IN COOPERATION WITH THE U.S. BUREAU OF LABOR STATISTICS
ESTIMATES ARE PRELIMINARY AND SUBJECT TO REVISION. SEE ANNUAL SUMMARY FOR DETAILS