Vermont Business Magazine The Vermont Department of Labor announced today that the seasonally-adjusted statewide unemployment rate for August 2014 was 4.1 percent. The number of employed fell 1,300 while the number of unemployed rose by 2,200. The labor force also fell by 800. These are all negative indicators. The rate itself represents an increase of four-tenths of a percent from the revised July rate (3.7 percent). The equivalent national average was 6.1 percent, which decreased by one-tenth of a percent from the previous month’s estimate. This is the third monthly increase to the statewide unemployment rate in Vermont in the past year. Vermont fell to the fifth best rate in the nation, down from fourth in July.
SEE TABLES BELOW
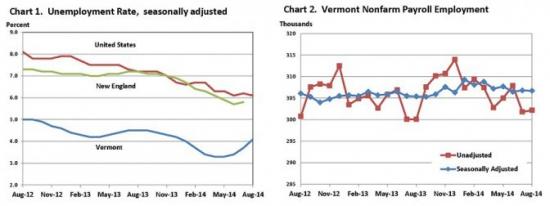 “Over the last year, more Vermonters are reporting being employed and fewer are reporting being unemployed. At 4.1%, Vermont’s unemployment rate is well below the national average of 6.1%. The monthly estimates, which can fluctuate, will be trued-up with additional data in early 2015. It is expected that the revised data will confirm improvements in the Vermont economy in 2014 when compared to 2013. It is the Vermont Department of Labor’s responsibility to assist individuals looking for work and partner them with the many Vermont employers looking for skilled employees. Call or visit a VDOL regional office to learn more about our services”, said Commissioner Annie Noonan.
August unemployment rates for Vermont’s 17 labor market areas ranged from 2.9 percent in Hartford to 5.3 percent in Bennington (note: local labor market area unemployment rates are not seasonally adjusted). For comparison, the August unadjusted unemployment rate for Vermont was 4.0 percent which reflects no change from the revised July level and no change from a year ago.
Not Seasonally Adjusted
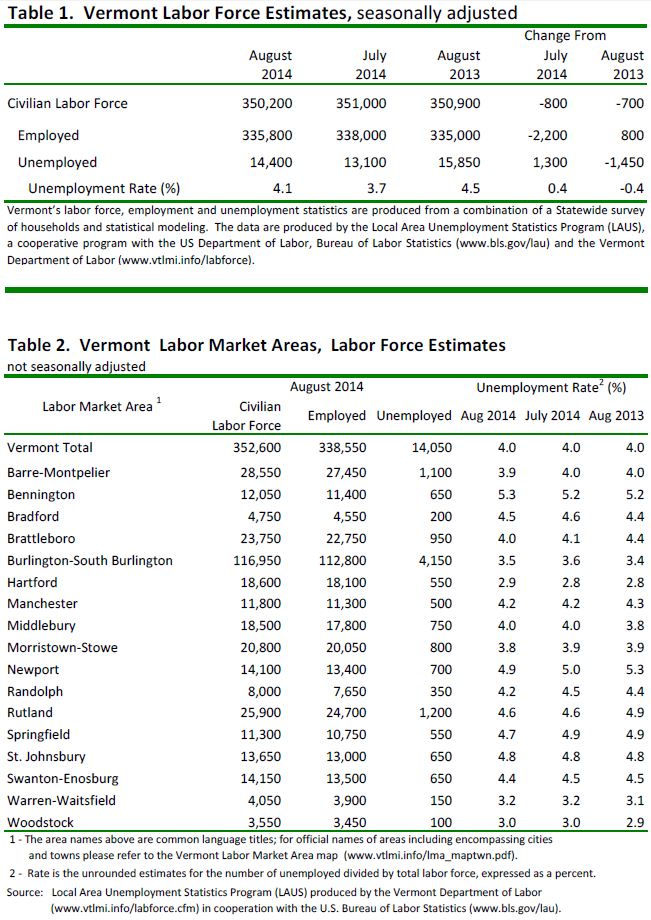
The preliminary ‘not-seasonally-adjusted’ jobs estimates for August show an increase of 400 jobs when compared to the revised July numbers. This reported over-the-month change does not include the 700 job decrease between the preliminary and the revised July estimates due to the inclusion of more data. The monthly increase seen in the August numbers was attributable to seasonal increases related to the Leisure & Hospitality industry. The broader economic trends can be detected by focusing on the over-the-year changes in this data series. As detailed in the preliminary ‘not-seasonally-adjusted’ August data, Total Private industries have increased by 0.5 percent (1,300 jobs) and Government employment has increased by 1.8 percent (800 jobs).
Seasonally Adjusted
The seasonally adjusted data for August reports a decrease of 100 jobs from the revised July data. As with the ‘not-seasonally-adjusted’ data, this over-the-month change is from the revised July numbers which experienced an 800 job decrease from the preliminary estimates. The seasonally adjusted over-the-month changes in August were minor at the sectorial level. Those with a notable percent increase include: Manufacturing (+400 jobs or +1.3 percent) and Education & Health Services (+300 jobs or +0.5 percent). Industries with a notable percent decrease include: Other Services (-200 jobs or -2.0 percent) and Leisure & Hospitality (-300 jobs or -0.9 percent).
Unemployment Rates for States
| Unemployment Rates for States Monthly Rankings Seasonally Adjusted Aug. 2014p |
||
|---|---|---|
| Rank | State | Rate |
| 1 | NORTH DAKOTA | 2.8 |
| 2 | NEBRASKA | 3.6 |
| 2 | SOUTH DAKOTA | 3.6 |
| 2 | UTAH | 3.6 |
| 5 | VERMONT | 4.1 |
| 6 | HAWAII | 4.3 |
| 6 | MINNESOTA | 4.3 |
| 8 | NEW HAMPSHIRE | 4.4 |
| 9 | IOWA | 4.5 |
| 10 | WYOMING | 4.6 |
| 11 | IDAHO | 4.7 |
| 11 | MONTANA | 4.7 |
| 11 | OKLAHOMA | 4.7 |
| 14 | KANSAS | 4.9 |
| 15 | COLORADO | 5.1 |
| 16 | TEXAS | 5.3 |
| 17 | MAINE | 5.6 |
| 17 | VIRGINIA | 5.6 |
| 17 | WASHINGTON | 5.6 |
| 17 | WISCONSIN | 5.6 |
| 21 | OHIO | 5.7 |
| 22 | INDIANA | 5.8 |
| 22 | LOUISIANA | 5.8 |
| 22 | MASSACHUSETTS | 5.8 |
| 22 | PENNSYLVANIA | 5.8 |
| 26 | ARKANSAS | 6.3 |
| 26 | FLORIDA | 6.3 |
| 26 | MISSOURI | 6.3 |
| 29 | MARYLAND | 6.4 |
| 29 | NEW YORK | 6.4 |
| 29 | SOUTH CAROLINA | 6.4 |
| 32 | DELAWARE | 6.5 |
| 33 | CONNECTICUT | 6.6 |
| 33 | NEW JERSEY | 6.6 |
| 33 | WEST VIRGINIA | 6.6 |
| 36 | ILLINOIS | 6.7 |
| 36 | NEW MEXICO | 6.7 |
| 38 | ALASKA | 6.8 |
| 38 | NORTH CAROLINA | 6.8 |
| 40 | ALABAMA | 6.9 |
| 41 | ARIZONA | 7.1 |
| 41 | KENTUCKY | 7.1 |
| 43 | OREGON | 7.2 |
| 44 | CALIFORNIA | 7.4 |
| 44 | MICHIGAN | 7.4 |
| 44 | TENNESSEE | 7.4 |
| 47 | DISTRICT OF COLUMBIA | 7.6 |
| 47 | NEVADA | 7.6 |
| 49 | RHODE ISLAND | 7.7 |
| 50 | MISSISSIPPI | 7.9 |
| 51 | GEORGIA | 8.1 |
p = preliminary.
NOTE: Rates shown are a percentage of the labor force. Data refer to place of residence. Estimates for the current month are subject to revision the following month.
Current Unemployment Rates for States and Historical Highs/Lows
| Current Unemployment Rates for States and Historical Highs/Lows Seasonally Adjusted |
|||||
|---|---|---|---|---|---|
| Aug. 2014p | Historical High | Historical Low | |||
| State | Rate | Date | Rate | Date | Rate |
| Alabama | 6.9 | Dec. 1982 | 14.3 | Apr. 2007 | 3.2 |
| Alaska | 6.8 | June 1986 | 11.5 | Apr. 2007 | 5.9 |
| Arizona | 7.1 | Jan. 1983 | 11.6 | July 2007 | 3.5 |
| Arkansas | 6.3 | July 1983 | 10.1 | Nov. 2000 | 4.0 |
| California | 7.4 | Oct. 2010 | 12.4 | Jan. 2001 | 4.7 |
| Colorado | 5.1 | Oct. 2010 | 9.1 | Jan. 2001 | 2.6 |
| Connecticut | 6.6 | Nov. 2010 | 9.5 | Oct. 2000 | 2.1 |
| Delaware | 6.5 | Dec. 1976 | 9.3 | Feb. 1989 | 2.8 |
| District of Columbia | 7.6 | Feb. 1983 | 11.6 | May 1989 | 4.8 |
| Florida | 6.3 | Mar. 2010 | 11.4 | Aug. 2006 | 3.3 |
| Georgia | 8.1 | Jan. 2010 | 10.4 | Dec. 2000 | 3.3 |
| Hawaii | 4.3 | Jan. 1976 | 9.9 | Dec. 2006 | 2.3 |
| Idaho | 4.7 | Feb. 1983 | 9.6 | Mar. 2007 | 2.7 |
| Illinois | 6.7 | Feb. 1983 | 12.9 | Feb. 1999 | 4.2 |
| Indiana | 5.8 | Jan. 1983 | 12.7 | Apr. 1999 | 2.6 |
| Iowa | 4.5 | Mar. 1983 | 8.6 | Oct. 1999 | 2.5 |
| Kansas | 4.9 | Aug. 2009 | 7.5 | Apr. 1979 | 3.0 |
| Kentucky | 7.1 | Jan. 1983 | 12.0 | June 2000 | 4.1 |
| Louisiana | 5.8 | Nov. 1986 | 12.8 | July 2006 | 3.6 |
| Maine | 5.6 | Jan. 1977 | 9.0 | Jan. 2001 | 3.1 |
| Maryland | 6.4 | Nov. 1982 | 8.4 | Feb. 2008 | 3.3 |
| Massachusetts | 5.8 | Jan. 1976 | 11.1 | Oct. 2000 | 2.6 |
| Michigan | 7.4 | Dec. 1982 | 16.8 | Mar. 2000 | 3.3 |
| Minnesota | 4.3 | Dec. 1982 | 9.1 | Mar. 1999 | 2.5 |
| Mississippi | 7.9 | Apr. 1983 | 13.5 | Apr. 2001 | 4.9 |
| Missouri | 6.3 | Feb. 1983 | 10.6 | Jan. 2000 | 2.8 |
| Montana | 4.7 | Mar. 1983 | 8.8 | Dec. 2006 | 3.1 |
| Nebraska | 3.6 | Feb. 1983 | 6.7 | Feb. 1998 | 2.2 |
| Nevada | 7.6 | Nov. 2010 | 13.9 | Apr. 2000 | 3.8 |
| New Hampshire | 4.4 | Sept. 1992 | 7.6 | May 1987 | 2.1 |
| New Jersey | 6.6 | Dec. 1976 | 10.7 | July 2000 | 3.6 |
| New Mexico | 6.7 | Mar. 1983 | 10.0 | June 2007 | 3.4 |
| New York | 6.4 | Nov. 1976 | 10.3 | Apr. 1988 | 4.0 |
| North Carolina | 6.8 | Feb. 2010 | 11.3 | Mar. 1999 | 3.1 |
| North Dakota | 2.8 | Feb. 1983 | 6.8 | Apr. 2014 | 2.5 |
| Ohio | 5.7 | Jan. 1983 | 13.9 | Jan. 2001 | 3.8 |
| Oklahoma | 4.7 | June 1983 | 9.2 | Dec. 2000 | 2.8 |
| Oregon | 7.2 | Jan. 1983 | 12.1 | Feb. 1995 | 4.7 |
| Pennsylvania | 5.8 | Mar. 1983 | 12.9 | Mar. 2000 | 4.0 |
| Rhode Island | 7.7 | Mar. 2010 | 11.9 | July 1988 | 2.9 |
| South Carolina | 6.4 | Dec. 2009 | 11.9 | Mar. 1998 | 3.2 |
| South Dakota | 3.6 | Feb. 1983 | 6.0 | Mar. 2000 | 2.5 |
| Tennessee | 7.4 | Jan. 1983 | 12.8 | May 2000 | 3.9 |
| Texas | 5.3 | Nov. 1986 | 9.3 | Jan. 2001 | 4.2 |
| Utah | 3.6 | Mar. 1983 | 10.0 | Mar. 2007 | 2.4 |
| Vermont | 4.1 | Jan. 1976 | 8.8 | Apr. 2000 | 2.4 |
| Virginia | 5.6 | Jan. 1983 | 7.8 | Dec. 2000 | 2.2 |
| Washington | 5.6 | Nov. 1982 | 12.2 | May 2007 | 4.4 |
| West Virginia | 6.6 | Mar. 1983 | 18.1 | Mar. 2008 | 3.9 |
| Wisconsin | 5.6 | Jan. 1983 | 11.5 | Feb. 2000 | 3.0 |
| Wyoming | 4.6 | Jan. 1987 | 9.1 | Apr. 1979 | 2.3 |
p = preliminary.
NOTE: Rates shown are a percentage of the labor force. Data refer to place of residence. Series begin in January 1976. Historical highs and lows show the most recent month that a rate was recorded in the event of multiple occurrences. Estimates for at least the latest five years are subject to revision early in the following calendar year.
Last Modified Date: September 19, 2014