Vermont Business Magazine and Morgan True, vtdigger.org Health insurance premiums for Vermont state employees are high compared to other states, according to a report released by the Pew Charitable Trust, and the workers themselves pay a relatively high amount for total health insurance. While the overall national average for the split in employer-employee contribution is the same 20 percent, the average premium paid in the US for a state worker is $963, while in Vermont it is $1,307. This means that the average Vermont employee pays $261.40 per month for health insurance, while the national average is $192.60.
Unlike most other states, Vermont pays a fixed percentage of the premium for all coverage tiers. This has resulted in workers taking a higher level of coverage, while more often including dependents in their plans. Vermont also has a relatively high level of “richness” in its plans, which includes cost sharing and breadth of health care covered. Nationally, state insurance plans are richer than large private employers.

 Strategies some other states have used to save money are to limit coverage of dependents and increase the premium contribution by employees. Pew points out, however, that this could increase the number of uninsured, lead to higher costs down the road to treat worse health conditions and reduce employee retention.
Because of the many variables between states and between plans, the Pew report found that even when the study controlled for family size and cost sharing, such as co-pays, coinsurance and deductibles, Vermont’s state employees still pay more than the national average for health care, the study found.
When controlling for those factors, the average cost to employees was $580. For Vermont state employees it was $712.
State employee health plans are typically more generous than plans offered by private sector employers. Virtually all state employee health plans, including Vermont’s, would be considered “platinum” plans on the new health exchanges.
Health insurance costs are second only to Medicaid when it comes to states’ spending on health care, according to the report. How states manage employee health benefits, and other elements of their compensation package, affects states’ fiscal health. It can also impact their ability to recruit and retain qualified workers.
Health plans also impact state workers’ well-being.
It’s important for policymakers to make “evidence-based decisions by … comparing themselves to their peers,” the report says.
However, the report’s authors caution that “higher spending is not necessarily an indication of waste, and lower spending is not necessarily a sign of efficiency.”
That’s because of variance in the regional cost of health services and the different demographic makeup of employees across states.
Vermont has an older population and relatively high costs for medical services, which could contribute to the higher cost of state employee health care.
The report identifies policy levers that states can explore when looking at employee health plans, such as lower cost sharing for high value services, higher premiums for pre-Medicare retirees – who typically cost health plans more than active employees – and more robust wellness programs.
The report is based on an analysis of data from 2011 to 2013 compiled by the actuarial firm Milliman in their Atlas of Public Employer Health Plans.
In 2014 Vermont changed administrators for its health plan from Cigna to Blue Cross Blue Shield of Vermont. The health plan itself is negotiated between the state and its employee union, the Vermont State Employees Association.
When the switch was announced, Gov. Peter Shumlin said it would save the state $10 million annually. Harold Schwartz, with the Department of Human Resources, said those savings do not mean the state will spend $10 million less on employee health care this year, but that it will spend $10 million less than it would have under the old contract.
Dave Bellini, chair of the Vermont State Employees Association’s committee on benefits, was not sanguine about the change.
He said he believes that Blue Cross will actually cost the state more money, but was chosen, he believes, because it will ultimately be the administrator for Green Mountain Care – the state’s planned universal health care program.
The report shows Vermont’s share of employee premiums was virtually static from 2011 to 2013 at roughly $94 million.
“The past three years, if we kept premium increases at zero, we were hitting it out of the park,” Bellini said. “With numbers like that why on earth would you switch to Blue Cross?”
In the first six months of 2014, Vermont and its employees have paid roughly $75 million in premiums, with the state’s share of that at close to $60 million, according to Schwartz. That suggests the 2014 total will be greater for the first time since 2011.
Schwartz was not familiar with the Pew Report and could not say if the state has, or is planning to, implement any of its recommendations.
Former Human Resources Commissioner Kate Duffy told VTDigger last year that the Blue Cross wellness plan and its commitment to health care reform were key reasons the company was selected.
The report is the latest in a series produced in collaboration with the MacArthur Foundation that aims to help states improve their health policies. An earlier report examined state spending on prison health care.
A forthcoming report will analyze state Medicaid spending.
PEW STATE EMPLOYEE HEALTH INSURANCE REPORT
In 2012, $865 billion was spent in the United States to insure 169 million people through employer-sponsored health insurance, which represented 31 percent of all health care spending, according to the Pew report. Public and private employers contributed $630 billion, or 73 percent, toward this total; employees picked up the difference. Employer sponsored insurance is a vital element of the American health care landscape, and an important component of employee compensation. It helps provide people with access to affordable care, protects workers and their families from unaffordable medical costs, and serves as a critical funding source for virtually every medical institution.
The cost of health insurance has become a leading budget driver for employers of all sizes and in all sectors. From 1992 to 2012, the average cost of insuring each employee and dependent doubled, after adjusting for inflation. This increase has led many employers—including states—to review the benefits they provide, benchmark their offerings to comparable employers, and seek ways to control costs.
Health insurance costs have become a significant portion of states’ overall health care spending, second only to Medicaid. Nevertheless, little has been known about how states’ employee health plans and costs compare with one another and with those of large, private sector employers. To provide policymakers and other stakeholders with information on state employee health care expenditures, as well as the factors underlying this spending, researchers from the State Health Care Spending Project—a collaboration between The Pew Charitable Trusts and the John D. and Catherine T. MacArthur Foundation— worked with actuaries from Milliman Inc. to produce a first-of-its kind analysis of the costs and characteristics of state employee health plans.* Although meaningful state-to-state comparisons are complicated by a number of factors, including who is covered (i.e., the number, age, and health of enrollees) and differences in health plan benefit design, this analysis offers a nationwide benchmark against which states can be compared.
The project found that in 2013:
• States spent $30.8 billion to insure 2.7 million employee households,† a slight uptick in spending from 2011 and 2012—the earliest years for which Milliman compiled data—after adjusting for inflation.
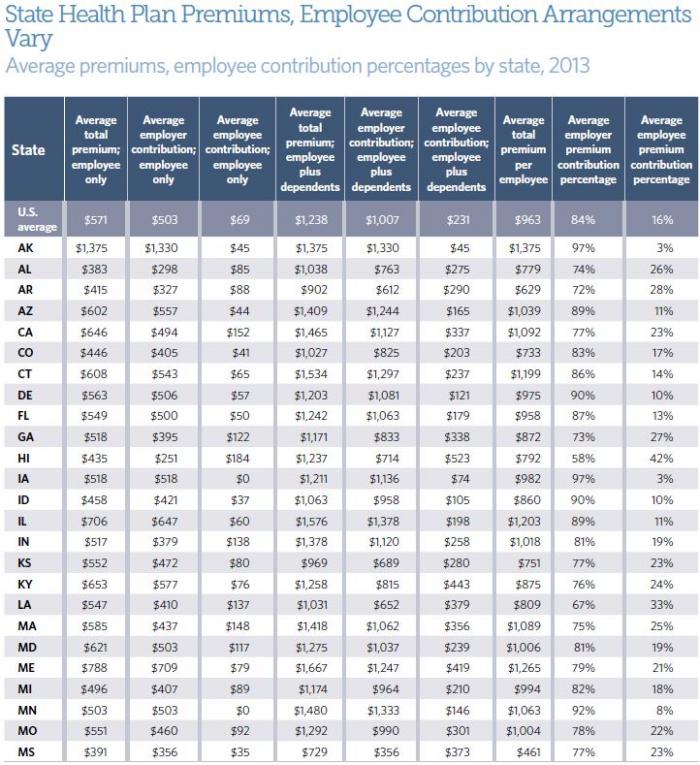
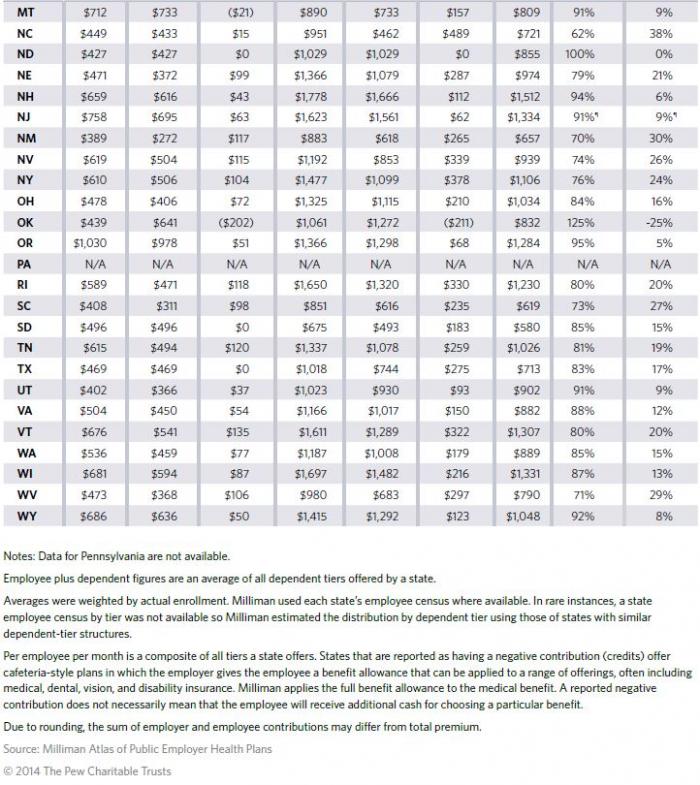
• The average per-employee per-month premium for coverage of employees and dependents was $963. States paid $808 (84 percent) of the total, and employees covered the remaining $155 (16 percent). Employees paid an additional $70 per month, on average, in cost-sharing elements such as deductibles, copayments, and coinsurance.
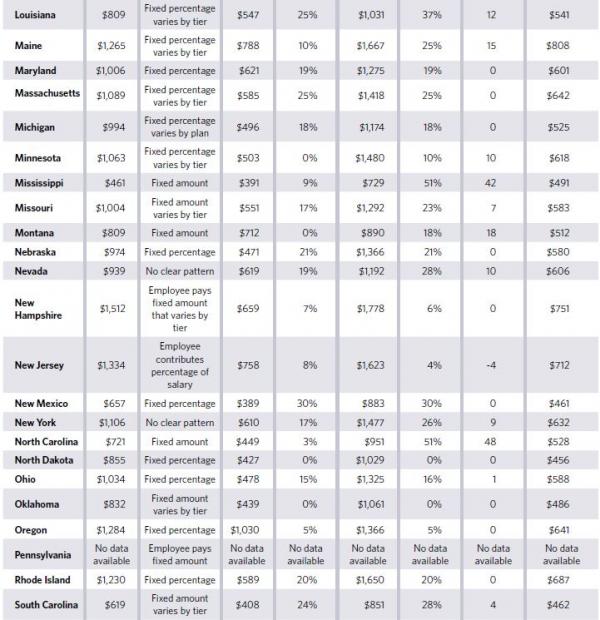
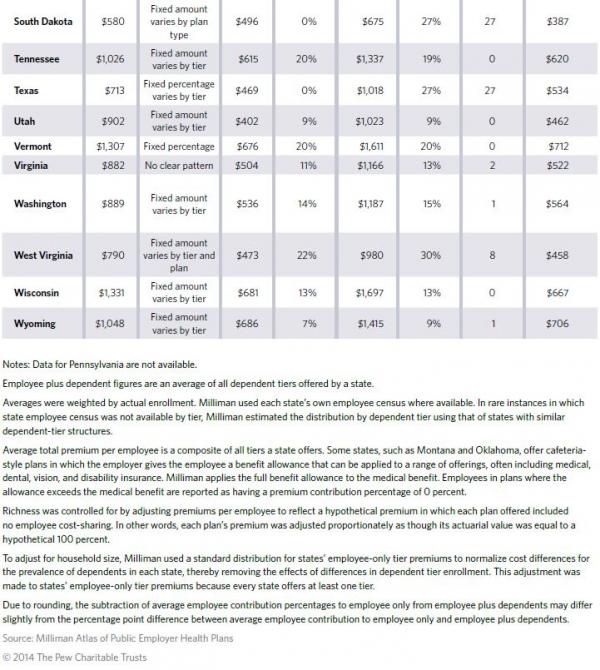
• The average per-employee premium masks sharp differences across the states. Arkansas, Mississippi, New Mexico, South Carolina, and South Dakota, for example, had relatively low per-employee premiums, whereas the average per-employee premiums for Alaska, New Hampshire, New Jersey, Vermont, and Wisconsin were comparatively high.
• One factor underlying differences in per-employee premiums is variation in “plan richness,” a commonly used term of art within the actuarial community. Richness reflects the relative cost sharing between an employer and employees based on the required deductibles, copayments, and coinsurance. State health plans were generally “rich,” paying on average§ 92 percent of the typical enrollees’ health care costs. By way of context, these plans would be designated “platinum” plans within the new health insurance marketplaces.¶,
• Annual deductibles—the amount employees must pay for covered health care services before the health plan begins to pay—are a significant determinant of plan richness. A common cost-containment strategy among many private sector employers in recent years has been the introduction of high-deductible health plans, which result in lower premiums. States have been relatively slower to offer such plans, and in those where they were offered, relatively few employees chose to enroll in them. Nineteen states offered at least one plan with an annual deductible of $1,500 or more, up from 16 states in 2011. Among those 19 states, a median of 7 percent of state employees enrolled in them. Nationwide, only 4 percent of state employees enrolled in such a plan. Forty-five percent were enrolled in plans with no deductible.
• Even after controlling for differences among states in average health plan richness and enrollee household size, a large range in premiums across the states remains. This suggests that other factors also have a substantial effect on premiums, such as variation in provider prices and physician practice patterns,** as well as age and health status of employees. Because of the range of variables that influence spending, higher spending is not necessarily an indication of waste, and lower spending is not necessarily a sign of efficiency.
How states manage their employee benefits—as well as other elements of their employee compensation package—affects their fiscal health; their ability to recruit and retain qualified staff to deliver critical public services; and their employees’ physical, mental, and financial well-being. In addition, as states try to reform the health care payment and delivery systems within their borders, how they structure the health insurance of their employees can serve as a model for other employers.
This report examines the project’s findings on state employee health care spending, explores the factors driving costs and states’ ability to influence these factors, and surveys a range of cost-containment strategies. These data and analysis offer important information as policymakers seek the best way to make their employee benefit systems effective, affordable, and sustainable.
The average total per-employee per-month premium for coverage of employees and dependents was $963 in 2013. States paid $808 (84 percent) of the total, on average, and employees covered the remaining $155 (16 percent). (See Table 1.) States such as Arkansas, Mississippi, New Mexico, South Carolina, and South Dakota had relatively low composite per-employee premiums, whereas the average per-employee premiums for Alaska, New Hampshire, New Jersey, Vermont, and Wisconsin were relatively high.5 Although some variation might be due to differing cost-containment efforts, it is also driven by other underlying factors, such as the richness of plan benefits (i.e., the share of enrollee costs paid by a health plan), average enrollee household size, regional differences in the cost of health services, and the demographics and health status of enrollee households. Because of the range of variables that influence spending, higher spending is not necessarily an indication of waste, and lower spending is not necessarily a sign of efficiency.
Premium comparisons
 In order to create nationwide benchmarks against which state health plan costs and characteristics can be compared, project researchers worked with Milliman actuaries to reconcile structural differences across states, producing two measures for comparison: a composite per-employee per-month premium and a composite premium that controls for average health plan richness and household size. Based on these analyses, this report also examines several reasons for interstate variation, only some of which are within the power of policymakers to influence. Some of the factors state decision-makers can affect include the number of plan tiers (i.e., specific household configurations with grouped premiums) states offer, the tier slope they employ (i.e., the rate at which premiums are set to rise with household size), and the richness of their plans. Cost drivers that policymakers have little or no control over include the age, gender, and health status of their enrollees, as well as differences in regional provider prices and physician practice patterns. Accounting for these sources of variation helps provide comparable information that policymakers can use to better understand how and why spending on employee health care differs from state to state.
Per-employee per-month premiums
State health plans differ with respect to how they group premiums for employees with single coverage and employees with different types of dependent coverage. These are known as “tiers.” Coverage offered by states is generally structured in one of three ways: *
1. Two tiers: employee only, and employee plus family.
2. Three tiers: employee only, employee plus one dependent, and employee plus two or more dependents.
3. Four tiers: employee only, employee plus spouse, employee plus child(ren), and employee plus spouse and child(ren).
This variation in tier structure makes 50-state premium comparisons challenging because, for example, premiums for employee plus spouse coverage in a state with four tiers cannot be accurately compared with premiums in a state that offers only two tiers in which two-person households are grouped with families of all sizes. Therefore, to accurately compare states’ employee health insurance premiums on a per-employee basis, variation in tiers must be normalized. The resulting composite number represents the average total premium per employee. (See Figure 1.) Comparing composite per-employee premiums captures both differences in the overall cost of health care per person and the impact of differences in the average household size per employee.
The average total per-employee per-month premium for coverage of employees and dependents was $963 in 2013. States paid $808 (84 percent) of the total, on average, and employees covered the remaining $155 (16 percent). (See Table 1.) States such as Arkansas, Mississippi, New Mexico, South Carolina, and South Dakota had relatively low composite per-employee premiums, whereas the average per-employee premiums for Alaska, New Hampshire, New Jersey, Vermont, and Wisconsin were relatively high. Although some variation might be due to differing cost-containment efforts, it is also driven by other underlying factors, such as the richness of plan benefits (i.e., the share of enrollee costs paid by a health plan), average enrollee household size, regional differences in the cost of health services, and the demographics and health status of enrollee households.
Because of the range of variables that influence spending, higher spending is not necessarily an indication of waste, and lower spending is not necessarily a sign of efficiency.
Controlling for plan richness, household size, and cross-tier subsidization
The differences among states discussed earlier can be attributed to many factors. In this section we control for three of those elements: variation among states in plan richness, enrollee household size, and cross-tier subsidization. Controlling for these elements helps to isolate differences that are due to other important factors affecting premiums but are largely beyond the control of state policymakers and other employers, such as the unit cost of health care in a state and the health status of employees. Quantifying the effects of these three determinants on premiums can help policymakers better understand how much these factors affect premium differences, and how much is a result of other influences.
Plan richness reflects the relative cost sharing between an employer and employees as defined by the required deductibles, copayments, and coinsurance. Breadth of services covered can also affect a plan’s richness since uncovered services are paid for by employees. But health plans offered by state governments—and most other large employers*—routinely cover a comprehensive set of services, including inpatient hospitalization, outpatient care, physician care, and pharmaceuticals, which together represent the vast majority of health plan costs. Therefore, experts point to variations in cost-sharing arrangements as a more significant driver of premium differences—among states and across plans within a state—than is the breadth of services covered.
Plans’ richness can be compared by measuring their respective actuarial values—which are expressed in percentage terms, representing the proportion of the cost of covered services that a health plan pays for an average enrollee. For example, a health plan with an actuarial value of 90 percent would cover 90 percent of allowed costs of the covered services for an average enrollee, and the enrollee would pay 10 percent in addition to any premium contribution. Individual members’ experiences may differ based on their actual use of services.
In addition to controlling for variation in plan richness,‡ plan premiums were normalized to account for differences in tier slope—the extent to which states increase premiums from the employee-only tier to the dependent tiers — which can result in one household size subsidizing another if premiums are not reflective of relative household costs.** Finally, Milliman also removed the effects of average enrollee household size differences, which can contribute to states spending more or less than another on a per-employee basis.
Altogether, these adjustments paint a clearer picture of differences in the unit cost of state employee health care across the country. Having isolated and controlled for much of what policymakers can directly influence, project researchers found that average employee-only premiums per month ranged from $387 and $440 in South Dakota and Idaho, respectively, to $808 and $846 in Maine and Alaska, respectively, with a median of $580 across the country. (See Figure 2.) The large range between premiums that remains after controlling for richness, household size, and tier slope suggests that other factors such as age, gender, and health status of enrollees, as well as regional differences in the cost of health services and provider practice patterns, have a substantial impact across the country.
Age, gender, and health status
The composition of individuals insured by a plan, known as the risk pool, can have a dramatic effect on health care costs. Important predictors of expected claims costs, and therefore premiums, include age, gender, and health status.
Age highly influences costs, though the strength of the correlation varies by gender and life stage. According to a study of commercial insurance costs sponsored by the Society of Actuaries, health care during the first year of life is very expensive and then drops dramatically until age 8, when it levels off throughout adolescence. Average costs for males remain stable throughout their 20s and then begin to increase steadily after age 30 through age 65 when most people become eligible for Medicare, the federal health insurance program for older Americans and people with disabilities. For females, however, average costs rise dramatically during their childbearing years, at which point average costs are more than double those for men of the same age. Average costs for females level off from their early 30s until their early 40s and then rise again to the age of Medicare eligibility.7 (See Figure 3.)
The connection between age, gender, and health care costs presents a challenge for state governments. On average, their insured populations are older and composed of a greater percentage of females than in the private sector.* According to Truven Health Analytics, a health care data management and consulting firm, state and local governments insured a higher proportion of older workers and dependents (age 50 or above) and a greater proportion of females than did private sector employers in 2010. Thirty-six percent of public sector health plan workers and dependents were ages 50-64, compared with 26 percent among private firms. (See Figure 4.) Similarly, females were more predominant in the insured population of public employers (57 percent) than that of private employers (51 percent).
The Congressional Research Service, a nonpartisan research division of the U.S. Congress, found a similar pattern. In 2011, 52 percent of full-time state government workers were between the ages of 45 and 64, compared with 43 percent of full-time private sector workers. With respect to gender, women held a much greater share of fulltime jobs in state government (59 percent) than in the private sector (42 percent).9 In both cases, the differences have expanded since 1976, the earliest year for which data were analyzed.
One explanation for the age variation between sectors is that public sector employees tend to stay with their employer longer. According to the Bureau of Labor Statistics, public sector employees had nearly double the median tenure (7.8 years) of workers in the private sector (4.2 years), and state employees had a median tenure of 6.4 years. This difference has remained consistent through the past decade.10 The bureau also found a similar age distribution pattern, with 75 percent of public sector workers age 34 and over, compared with 60 percent in the private sector.
Health status of enrollees
Like age and gender, the prevalence of chronic health conditions, such as heart disease, cancer, and diabetes, also influences health care costs. According to the Centers for Disease Control and Prevention, chronic conditions are responsible for more than 75 percent of health care costs.11 People covered by public sector employers had a higher prevalence in 2010 of every chronic condition tracked by Truven Health Analytics than people covered by private sector employers. For example, diabetes and hypertension were 48 percent and 59 percent more prevalent within the public sector population, respectively. Even after adjusting for age and gender, which are correlated with chronic conditions, Truven found that public employees and their dependents had a greater prevalence of chronic conditions.*
Regional differences in prices, wages, and utilization
Regional differences in provider prices and wages, particularly in regard to hospital-based care, as well as variation in utilization of services across regions affect health care costs. A seminal three-year study by the Institute of Medicine found that 70 percent of regional variation in spending for people insured by commercial health plans resulted primarily from price differences among providers, which remained consistent over time. Differences in utilization of health care services and cost of living were responsible for the remaining 30 percent. Other researchers have found that utilization has a more significant effect.
Prices are established through negotiations among commercial insurers and physicians, hospitals, and other health care providers. The Institute of Medicine authors pointed to variation in the negotiating power of each side—which is driven, in part, by their respective local market power—and differences in efficiency among care providers as two reasons for divergences in regional costs.14 This leads to greater variation in prices paid by commercial insurers than among other health care payors, such as Medicare, which sets prices more uniformly across the country without negotiation.
In a related study investigating reasons for variation in inpatient care prices across hospitals, the clearest difference between low- and high-price hospitals was their size and market share.15 High-price hospitals also were more likely to be major teaching hospitals and to offer specialized facilities and services, making their exclusion from health plan networks difficult for plan administrators. Some of the variation could also be attributed to differences in the health status of patients and quality of care.
Strategies to influence costs
State policymakers are pursuing ways to rein in health care costs without harming their enrollees. The remaining section of this paper examines a variety of these approaches, which offer important lessons to policymakers seeking the best ways to make their states’ health plans effective and affordable. While this paper’s scope did not include an examination of the potential health outcomes of these strategies on state employees and their families, state policymakers should certainly consider these outcomes as they adopt new programs and monitor current ones.
Impact of premium contribution arrangement on enrollment
Premium contribution arrangements can affect employers’ total costs because they can have a significant impact on the employees’ plan selection. For example, some states, such as North Carolina, base their contribution on the lowest-cost plan and require employees who select a higher-cost plan to pay the full difference in premiums. This can drive more employees to select the lower-cost plan. Alternatively, some states, such as Oregon and New Mexico, contribute a fixed percentage for all plans, creating a greater incentive for employees to enroll in highercost plans.
The share of premiums employers pay for dependent tiers also affects employee enrollment decisions and therefore state spending. For example, a state may encourage an employee with dependents to consider other options—a less expensive state plan, the spouse’s employer-sponsored insurance, or the new health insurance marketplaces*—by requiring the employee to pay a greater percentage or the entire cost of dependent coverage. This strategy can reduce the number of persons covered—per employee and in total—and lower the state’s total costs. However, this arrangement creates a heightened risk of dependents going uninsured.
In 2013, employees paid, on average, 20 percent of dependent-tier premiums—7 percentage points higher than the average share paid for employee-only coverage.16 In 20 states, including Delaware, Michigan, and Utah, the percentage of the premium paid by employees is the same for all coverage tiers. On the other end of the spectrum, Kentucky, South Dakota, and Texas, among others, require employees to pay a substantially greater percentage for coverage of dependents than for the employee-only tier. (See Figure 5.)
The most common arrangement for premium contributions by states is to vary the premium paid across tiers by paying a larger dollar amount—though not necessarily a larger percentage—for dependent tiers than for the employee-only tier. Alabama, Colorado, and Utah, as well as others, follow this strategy. Some states, such as North Dakota, Ohio, and Vermont, pay a fixed percentage of the premium for all coverage tiers.
A small group of states place a significantly greater share of the premium on employees who wish to cover dependents than on those who choose employee-only coverage. Mississippi and North Carolina, for example, pay a fixed dollar amount for all employees, regardless of the coverage tier. (See Table 2.) In these states, the employer pays all or nearly all of the cost for employee-only coverage, while the employee is wholly responsible for the additional cost of covering dependents. This arrangement creates a clear financial incentive for employees to seek alternative coverage for their dependents, but it also increases the risk that dependents could go uninsured.
States differ from private sector employers in how they share costs with employees for dependent coverage. States cover, on average, a higher percentage of monthly premiums for family coverage. According to the Kaiser Family Foundation’s 2013 Employer Health Benefits Survey, the national average employer contribution was 73 percent for large (200 or more employees), for-profit employers in 2013.18 State governments overall contributed an average of 80 percent, according to Milliman’s Atlas.
Impact of tier structure on state spending
States can affect their costs by using tier structure to influence the size and composition of the people covered by the health plan. Under a two-tier structure, an employee covering a spouse and an employee covering children but not a spouse are charged the same monthly premium as an employee covering a spouse and children. The premium for an employee plus two or more dependents is lower under a two-tier structure than it would be under a three- or four-tier structure for the same plan because two-person households reduce the average family size, which lowers the average cost, and employees who cover only one dependent have lower average costs than larger families (i.e., employee, spouse, and children). Therefore, a two-tier structure creates an incentive for larger households to enroll in their employer-sponsored insurance and a potential disincentive for smaller households to subscribe, thereby attracting more enrollees per employee.
By adopting a three- or four-tier structure, employers offer a lower rate than would be available under a two-tier structure to spouses and partners without children, single parents, and employees with spouses who have access to other insurance. This reverses the incentive for employees of various household sizes. Smaller households may have a greater financial incentive to enroll than they would under a two-tier structure while larger households may have a greater disincentive. This may lead some employees with several dependents to consider other options, such as using a spouse’s employer-sponsored insurance for coverage.
The most common arrangement among states in 2013 was four tiers, which 23 states offered. The next two most common tier structures were two tiers (11 states) and three tiers (nine states). (See Table 3.)
Premium contributions for pre-Medicare eligible retirees
In recent decades, the share of large employers offering retiree health benefits has fallen steeply, from 66 percent in 1988 to 28 percent in 2013,*, 20 with state and local governments remaining much more likely to offer retiree health benefits than private sector employers.21 All but six of the 49 states for which data were available† offered nondisabled retirees under age 65, or “early retirees”—and therefore not yet eligible for Medicare—and their dependents the same health plans as active employees as part of the states’ retiree benefits packages. Early retirees generally are required to have worked a certain minimum number of years for the state to be eligible for state-sponsored health insurance. Like such retirees of other employers, they need transitional health insurance to stay covered during the years prior to becoming eligible for Medicare.
The states that provide this transitional coverage vary in how they set premiums for retirees relative to active employees, which affects how much states pay for their health plans. Forty-three of the 49 states permit early retirees and their dependents to enroll in active employee health plans. Of these 43 states, 29 enroll retirees at a premium rate that also applies to employees. In most cases, the rates are exactly the same. In some cases, the retiree rates are slightly higher—ranging from 1 percent to 5 percent—than the active employee rate. Three states set their retiree premiums above their active employees’ rate but below what is needed to cover the entire additional cost to insure early retirees.* Eleven states allow enrollment at a separate rate that appears to be intended to cover the entire additional cost of early retirees.
Table 4 presents an example of each rate-setting approach employed by states in 2013. California, for instance, established a blended rate that applied equally to active employees and retirees. Idaho’s early retiree premium was 19 percent higher than the rate for active employees but probably still insufficient to cover the higher costs of the early retirees. Finally, Louisiana set a rate for early retirees that is 87 percent higher than that set for its active employees, which is likely to make up for the higher costs of this population.
Cost sharing of services
In addition to shifting some of the cost of care to employees to save state money, cost sharing can also be used to influence employees’ behavior—encouraging them to reduce their utilization of certain types of care, such as inappropriate use of emergency department services, or to explore less costly treatment options and care settings. Many employers also use tiered prescription drug formularies—the prescription drugs covered by a plan—to further the use of lower-cost generic drugs by charging employees less for these than for the medically equivalent but more expensive brand-name drug.
A majority of state government employees enrolled in health plans that included relatively modest amounts of cost sharing. Based on Milliman’s actuarial value calculations, the average state government employee enrolled in a health plan that had an actuarial value of 92 percent in 2013.* By way of context, these plans would be designated “platinum” plans within the new health insurance marketplaces.†, 24 In 42 states, the average health plan had an actuarial value of at least 88 percent. Seven states had actuarial value averages between 80 and 87 percent.25 Plans with an actuarial value of between 78 and 82 percent would be designated “gold” plans within the new health insurance marketplaces.
For the average health plan in every state, an average of $963 per employee per month was paid toward
plan premiums for coverage of employees and dependents. Of this total, states paid $808 (84 percent), and employees covered the remaining $155 (16 percent). Employees contributed an additional $70 per month on average toward cost-sharing elements such as deductibles, copayments, and coinsurance.
Table 5 illustrates some of the differences in the cost-sharing arrangements among plans. South Carolina’s savings plan, the least rich of the three presented, required employees enrolled in the employee-only tier to pay the first $3,000 of non-preventive services and then 20 percent of all additional costs up to an annual out-of-pocket maximum of $5,000. Indiana’s slightly richer consumer-driven health plan set a lower annual deductible of $2,500 for its employee-only tier, and the state contributed to an account that employees can use to pay for qualified health care services, partially offsetting the cost of the deductible. Finally, Kaiser’s HMO plan in California, the richest of the three plans shown in Table 5, required no annual deductible, charged much lower copayments, and had an annual out-of-pocket maximum of $1,500.
Nationally, employers have shifted a greater percentage of costs to employees over the past decade. From 2006 to 2013, the share of employees of large firms (200 or more workers) in the United States enrolled in a health plan with an annual deductible rose from 54 percent to 78 percent. Over the same period, the average deductible for employee-only coverage among employers of all sizes nearly doubled, increasing from $584 to $1,135.
More recently, the trend toward offering health plans with annual deductibles has also occurred among state employers. Between 2011 and 2013, the percentage of state employees enrolled in a health plan with an annual deductible rose from 51 percent to 55 percent. Over the same period, the average deductible for employee-only coverage increased by 19 percent from $479 to $570.
The number of states offering employees at least one health plan with a deductible increased from 41 to 45 from 2011 to 2013. Twenty-four states, however, also offered at least one health plan to employees in 2013 that did not include a deductible, and five states—Maryland, New Hampshire, New York, Rhode Island, and Texas—offered only health plans without deductibles.*
High-deductible health plans
Helping to drive the nationwide increase in both the number of employees enrolled in plans with deductibles and the average amount of the deductibles is the shift many employers have made to high-deductible health plans. These plans require employees to pay at least $1,250 toward covered, nonpreventive services before the health plan pays anything. In return, they often have lower total premiums than comparable plans with lower deductibles. High-deductible health plans are frequently paired with a health reimbursement arrangement, or HRA, or a health savings account, or HSA, which provide a means by which employees can pay out-of-pocket costs on a pretax basis.
From 2006 to 2013, the share of employees of large employers (200 or more employees) who were insured by plans with an annual deductible of at least $1,000 for employee-only coverage increased from 6 to 28 percent. Similarly, the percentage of employees in plans with annual deductibles of at least $2,000 for employee-only coverage increased from 1 to 8 percent.
Compared with the private sector, state governments have been slower to offer high-deductible health plans. In 2013, 19 states offered plans with a deductible of at least $1,500 for employee-only coverage—eight of which paired these plans with an HRA or HSA to which the state contributed—an increase from 16 states in 2011. Among these states, a median of 7 percent of state employees enrolled; nationwide, few state employees enrolled in these plans. Most employees enrolled in plans with no annual deductible (45 percent) or in plans with a deductible of less than $500 (31 percent). Only 9 percent of enrollees are in plans with deductibles of $1,000 or more. (See Figures 6 and 7.)
Impact on costs and outcomes
Initial results of studies seeking to quantify the impact of high-deductible health plans on health care costs, utilization of services, and health outcomes have found both attractive and unattractive outcomes. It should also be noted that, as with any relatively new program or policy, new research findings may emerge as more time passes and the longer-term effects of enrollment in high-deductible health plans become clearer.
Proponents of high-deductible health plans argue that shifting more responsibility for health care spending and decision-making to employees creates an incentive for enrollees to be more prudent in their use of health care and more engaged in the selection of providers and treatment options. The RAND Corp., a nonpartisan research institution, examined health spending patterns among more than 800,000 households insured by 59 large employers from 2003 to 2007. It found that health spending dropped an average of 21 percent for families who switched to a plan with a deductible greater than $500 per person compared with similar families in plans with a lower deductible or no deductible.29 Cost savings, however, were significant only for enrollees in plans with a deductible of at least $1,000 per person.
Among families enrolled in high-deductible health plans, roughly two-thirds of the savings resulted from fewer visits with providers. Lower spending per encounter caused the remaining one-third, suggesting patients were making different choices about tests and treatments. Enrollees in high-deductible health plans used fewer brand-name drugs, had fewer visits to specialists, and had fewer hospitalizations than enrollees in other plans.
Similarly, the Employee Benefit Research Institute studied a large employer from 2006 to 2010 that adopted a high-deductible health plan and HSA for all of its employees, and compared enrollees’ health care costs to a control group. Health care spending dropped by 25 percent in 2007, the first year of implementation. Spending in later years was also lower than in 2006, although by slimmer margins. Among the spending categories analyzed, only pharmacy and laboratory spending fell by a statistically significant level throughout the study period. There was no statistically significant reduction in spending related to inpatient hospital stays, an expensive category over which employees often have little control.
Critics of high-deductible health plans contend that health care consumers lack sufficient information to make informed health care decisions, and changes in utilization can harm patients, which ultimately increases overall health care costs. In a survey of enrollees of these plans paired with an HSA or HRA, McKinsey & Company, a consulting firm, found that a majority were unsatisfied with the extent of provider information—particularly with respect to price variation—available to them.32 A separate survey of 42 large employers offering similar plans found that only 10 percent of them characterized the price and quality information provided to their employees as “good” or “excellent.”
The same RAND study that identified cost savings also found that reductions in preventive care occurred even when the plan waived the deductible for preventive services, which may suggest that employees do not fully understand the rules of the plan and/or the importance of such care. Rates for childhood vaccinations, mammography, cervical cancer screening, and colorectal cancer screening were all lower for families enrolled in high-deductible health plans compared with those who were not. And evidence suggests that increased cost sharing is also associated with reduced utilization of prescription drugs, including those prescribed to treat hypertension and high cholesterol, which are generally considered to be of high value.
Value-based insurance design
As employers have turned their attention to the effects of cost-sharing arrangements in recent years, value-based insurance design (V-BID) has gained momentum. The application of V-BID can take different forms, but a common principle sets cost-sharing elements such as copayments and deductibles lower for services regarded as high value. The goal is to promote adherence to the use of high-value preventive or health-maintenance services—for example, prescription drugs to treat hypertension, diabetes, high cholesterol, and asthma—to reduce acute episodes and the eventual need for more invasive and expensive care such as surgical interventions.
At the federal level, the Affordable Care Act took a step toward greater adoption of V-BID by requiring most health plans to cover a set of preventive services, such as mammograms and screenings for cervical cancer, without any member cost sharing—including an annual deductible—when delivered by a network provider.
Some states have also incorporated V-BID into their employee health plans. In October 2011, Connecticut launched the Health Enhancement Program (HEP) for its employees. HEP requires employees to, among other things, receive age-appropriate preventive services, complete health risk assessments and evidence-based screenings, and accept chronic disease management services when appropriate. In return, employees who elect to enroll in HEP and meet its requirements pay lower premiums and out-of-pocket costs than those who do not. The implementation of the program is too recent to evaluate whether it has yielded cost savings, but early results indicated an increase in primary care visits and a reduction in specialty care and emergency room visits.
Research on the broader use of V-BID by other employers has generally not found a reduction in expenditures. Introduction of lower or waived copayments on high-value services often results in at least a short-term increase in expenses because even employees who had previously complied with all recommended care must be offered the lower or waived copayments. A systemic review of 13 studies on V-BID programs found that they were consistently associated with increased utilization of services designated as “high value,” potentially improving care quality and health outcomes without greatly affecting total health expenditures.36 A February 2014 analysis of Blue Cross Blue Shield of North Carolina’s V-BID program, which, beginning in 2008, reduced copayments for drug treatments for hypertension, hyperlipidemia, diabetes, and congestive heart failure, also found no cost savings, though the researchers noted that the program may become more cost-effective over the long term as the impact on participants’ health becomes clearer.37 Given state employees’ longer tenure than private sector employees, state governments may achieve a cost savings using V-BID that would elude other employers.
Breadth of provider networks
Plans vary in the breadth of providers they make available to their enrollees. Plans with wide provider networks cover most or all providers throughout the health plan’s service area. Narrower networks limit the physicians and/or hospitals available to their enrollees. The ability to limit the provider network generally exists only in states—or regions within a state—in which there are a sufficient number of providers to enable a health plan to exclude some providers without inappropriately limiting access to care. Plans typically target for exclusion those providers they consider to be unjustifiably expensive, which requires statistically valid data that can be used to measure and differentiate providers. Regional health maintenance organizations, which require enrollees to live or work in a particular region to be eligible for coverage, typically offer limited networks. Larger insurers may also offer plans that require enrollees to receive services from a subset of their standard network of providers.
Plans with narrower provider networks either do not cover out-of-network care except in an emergency or require enrollees to share a higher percentage of the costs for services provided outside the narrower network. This second approach is called a tiered network. In exchange for restricting the available providers, limited and tiered network plans offer lower premiums and/or reduced member cost sharing than comparable plans with broad provider networks.
Between 2007 and 2013, the share of all employers whose largest health plan included a tiered or limited provider network grew from 15 percent to 23 percent, according to the Kaiser Family Foundation and Health Research & Educational Trust.38 When successful, this practice can slow premium growth, engage enrollees in their health care choices by incentivizing cost-conscious decision-making, and expose cost differences among providers that may be unjustified because their health outcomes are very similar or identical.
Proponents of narrow or tiered networks point to evidence of an inconsistent connection between the cost of health care and quality of services. The RAND Corporation systematically reviewed 61 studies investigating the association between quality and cost and found that only one-third of them reported a positive or near-positive association. Most studies concluded that the association was small to moderate, regardless of whether it was positive or negative.
Narrower networks can also help states contain costs in other ways. Massachusetts, for example, has offered its employees limited and tiered network plans for nearly a decade. According to the Massachusetts Group Insurance Commission, the agency that administers benefits for state and local employees and retirees, limited and tiered provider networks have occasionally provided the state’s health plans with an advantage during contract negotiations with providers. In a few instances, a provider group or hospital has accepted lower reimbursement rates in return for the plan including it in a network for which it charges lower premiums and/or less cost sharing because the provider expects this incentive to generate more business, and it avoids the potentially negative stigma of being designated as “high cost.”
As tiered and limited network plans have grown, however, they have encountered resistance from some providers and patients. Physicians in particular have questioned the reliability of the data and methodologies employed to determine in which network a provider should be placed. Patients, who may be attracted to lower premiums, may also grow frustrated when care from their preferred provider is not covered or comes with higher out-of-pocket costs. In a February 2014 poll conducted by the Kaiser Family Foundation, a slight majority (55 percent) of people enrolled in an employer-sponsored health insurance plan preferred a more expensive plan with a broader network over a less costly plan with a limited range of doctors and hospitals.41 Those who were either uninsured or purchased their own coverage had the opposite preference.
In some respects, limited and tiered provider network plans are similar to the managed care plans of the 1980s and 1990s. At that time, insurers’ HMO plans consisted of more limited provider networks, and patients were directed to particular providers. These plans offered consumers a trade-off: lower premiums in exchange for more restricted provider networks.
However, as a result of consumer and provider backlash, insurers expanded their provider networks. Over time, insurers’ provider networks included virtually all of the hospitals and physicians in a given service area, and the role of insurers as “care managers” diminished.
The newly developed tiered network and limited network plans attempt to re-engage consumers in making more informed decisions about their care, offering a lower-cost option for employees and employers while providing enrollees with a more limited choice of providers than under a broad network plan. These plans make greater use of data measuring the quality of provider care, which were not as prevalent or rigorous in earlier decades.
Workplace wellness programs
In recent years, it has become increasingly common for employers to experiment with ways to encourage employees to improve their health as a means of containing costs, reducing absenteeism, and increasing the well-being of their staff members, particularly those with one or more chronic conditions. These strategies take a variety of forms, ranging from using health-risk surveys to create personalized health improvement plans to linking employees’ shares of premiums to whether they participate in employers’ wellness programs and/or to various health metrics, such as whether they smoke. Federal regulations issued in June 2013 increased the maximum permissible reward under a health-contingent wellness program from 20 percent to 30 percent of the cost of coverage. The maximum permissible reward for programs aimed to prevent tobacco use was increased to 50 percent.42 For example, an employee who smokes and is not enrolled in a tobacco cessation program may be charged an additional surcharge of up to 50 percent of the total premium for the plan.
North Carolina’s State Health Plan for Teachers and State Employees was an early wellness program adopter. In 2004, the health plan partnered with the state’s Division of Public Health, Office of State Personnel, and other agencies to develop a model worksite wellness program to guide other agencies.43 Before this was done, state agencies and universities faced several obstacles to implementing such programs. For example, commercial wellness vendors that offered weight loss and fitness programs purchased directly by employees were not permitted on state property without a contract. Positive results from a pilot weight management program helped build legislative support to expand it throughout state government.
Some research has found that these programs save money. Investigators at Harvard University determined that medical costs and costs related to absenteeism each fell by about $3 for every dollar spent on certain wellness programs, though the costs tend to be front-loaded while the benefits take time to accumulate.44 Large employers implemented the vast majority of these programs, suggesting that states might achieve comparable results.
Additionally, because state health plan enrollees have a greater prevalence of chronic conditions than enrollees in the private sector, and state employees have a longer tenure and are often covered as pre-Medicare eligible retirees—increasing the chance that their employers will reap the benefits that can take time to develop—these initiatives may be particularly effective for states.
At the same time, critics have raised important questions. In one case, researchers who reviewed results of randomized controlled trials found that financial incentives are often ineffective for influencing behavior, and savings may be more attributable to a shift in costs to those with greater health risks than to improved health outcomes. A study by the RAND Corp. found that, where wellness programs exist, fewer than half of the employees complete clinical screenings or health risk assessments, often the first steps of the program, though the study did find meaningful health improvements and savings among those who did participate.
Finally, savings may also be offset by providing financial incentives to employees who would behave healthfully (i.e., not smoke, exercise regularly, receive appropriate medical attention, and take prescription drugs for their chronic conditions) on their own volition because employers cannot exclude these members from the incentive program.
Reference pricing
States generally have little direct control over price differences among providers within their market. However, they can use narrow or tiered provider networks to highlight cost differences and to limit the impact of price variation by steering care toward more cost-efficient providers. While not directly affecting price differences, narrower health plans encourage members to receive care from lower-cost, high-quality providers, as well as impact health plan and provider contract negotiations.
Another policy option is the use of reference pricing, which has historically been used as part of the benefit management for prescription drugs and more recently has been extended to other medical services. Under a reference price model, a health plan sets a maximum amount that it is willing to pay (i.e., the reference price) for a prescription, service, or procedure. Employers typically strive to set a price that provides employees with qualified provider options within a reasonable distance from their homes. If enrollees receive care from a facility that charges more than the reference price, they are responsible for paying the additional amount out of pocket. This arrangement can save money by directing enrollees—who in the absence of such guidance may assume that cost and quality are invariably correlated—toward cost-efficient providers and motivating providers to charge at or below the price threshold.
The use of reference pricing for prescription drugs applies to drugs that have a generic or therapeutic equivalent. If enrollees wish to take a brand-name drug for which there is a generic or therapeutic equivalent available, they are responsible for the marginal difference in cost. More recently, some payors have applied reference prices to certain elective (nonemergency) procedures and services, such as inpatient orthopedic surgery, outpatient arthroscopy, and imaging and laboratory services.
In 2011, the California Public Employees’ Retirement System implemented reference pricing for hip and knee replacements, and extended it to outpatient colonoscopies, cataract surgeries, and arthroscopies the following year. A recent evaluation of the initial results of the initiative reports cost savings for the state and its employees, heightened awareness among employees of the cost differences among providers, and increased willingness of some hospitals to lower their rates. In 2011 and 2012, the program is estimated to have saved the system $5.5 million.* Most of the savings each year stemmed from a reduction in reimbursement rates to hospitals.
As with limited and tiered networks, the success of reference pricing depends on the availability of a sufficient number of providers to ensure adequate access to care, enough price variation to warrant the establishment of such parameters, and statistically valid data that can be used to measure and differentiate providers. Employers must also communicate the program clearly to employees and assist them in making informed decisions so that they avoid inadvertently receiving care from a provider that exceeds the price threshold.
Covering dependents in the Children’s Health Insurance Program
The Children’s Health Insurance Program (CHIP) was created in 1997 to provide health coverage for children in families with incomes above Medicaid eligibility thresholds but who may still be unable to afford—or are not offered—health insurance. Its premiums and cost-sharing requirements are routinely lower than those of state employee health plans for dependent coverage, while the comprehensiveness of its coverage is comparable.
CHIP is administered by states, but the program is jointly funded with the federal government, which
contributes at least 65 percent of the cost of the program. The Affordable Care Act increased the federal share by 23 percentage points, bringing the average federal matching rate for CHIP to 93 percent from 2015 to 2019. A second provision provides states with the option to extend eligibility for CHIP to children of public employees if (a) the state’s annual increase in per-employee expenditures for dependent health coverage is not less than the annual increase in medical inflation since 1997, or (b) the state demonstrates that the employee share of premiums and cost sharing for all state health plans would exceed 5 percent of the family’s income.
Before this change, federal policy prohibited states from enrolling children of public employees in the CHIP program, regardless of their income. By adopting this option, states will save money that currently goes to employees’ health benefits, while also giving their lower-income employees access to comprehensive, relatively low-cost health coverage. As of January 2013, 12 states* had done so.
Conclusion
As large employers, state governments purchase and manage the health plans of more than 2.5 million employees and their families. This spending constitutes a substantial portion of states’ overall health care expenditures, totaling $30.8 billion in 2013. How they manage their employee benefits affects states’ fiscal health; their ability to recruit and retain qualified staff to deliver critical public services; and state employees’ physical, mental, and financial well-being. It is critical that state policymakers make evidence-based decisions by, among other strategies, comparing themselves to their peers. The benchmark data presented in this report on premiums, premium contribution arrangements, and cost-sharing arrangements, as well as information on steps states can take to influence costs, provide a solid base of evidence for such decision-making.