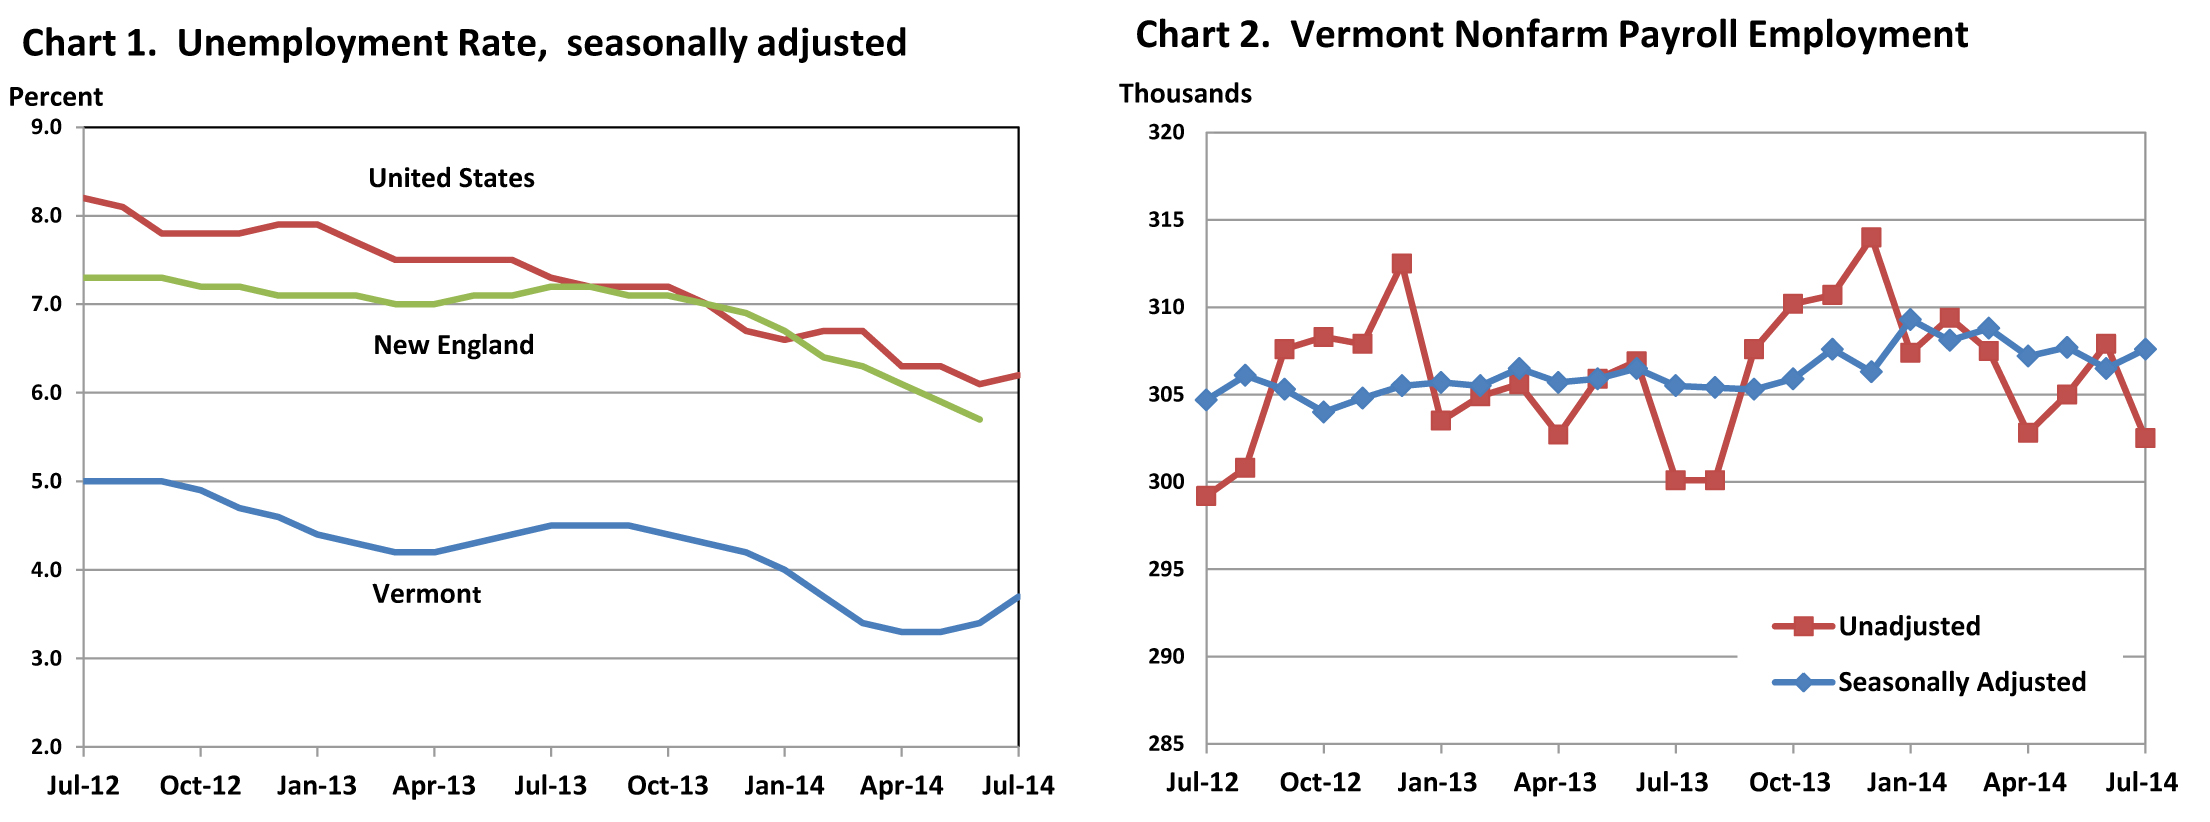
The Vermont Department of Labor announced today that the seasonally-adjusted statewide unemployment rate for July 2014 was 3.7 percent. This represents an increase of three-tenths of a percent from the revised June rate (3.4 percent). The equivalent national average was 6.2 percent, which increased by one-tenth of a percent from the previous month’s estimate. This is the second monthly increase to the statewide unemployment rate in Vermont in the past year. Vermont’s unemployment rate is tied for fourth lowest in the country.
“This month’s slight increase mirrors the same trend we saw last summer in Vermont, and we hope this will resolve as we move into the early fall, as the economic recovery in Vermont has been slow, but steady. Vermont still has one of the lowest unemployment rates in the nation, and our Department is engaging Vermonters in skill assessment and training and job placement. We are reaching out to employers with job vacancies and setting up specific job training and subsidized on-the-job training opportunities to meet their needs. We have funding available to assist all Vermonters and all Vermont employers. Call or visit a VDOL regional office to participate in our services”, said Commissioner Annie Noonan.
State of Vermont Overview:
The Vermont seasonally adjusted unemployment rate increased three-tenths of a percent in July to a statewide average of 3.7 percent. The comparable rate for the United States (6.2 percent) increased one-tenth of a percent from the revised June estimate. The seasonally adjusted Vermont data for July show the Vermont civilian labor force increased by 200 from the prior month estimates. The number of employed decreased by 950 and the number of unemployed increased by 1,150. The over-the-month changes to the number of unemployed and the unemployment rate were statistically significant in the seasonally-adjusted series.
July unemployment rates for Vermont’s 17 labor market areas ranged from 2.8 percent in Hartford to 5.2 percent in Bennington (note: local labor market area unemployment rates are not seasonally adjusted). For comparison, the July unadjusted unemployment rate for Vermont was 4.0 percent which reflects an increase of three-tenths of a percent from the revised June level and a decline of four-tenths of a percent from a year ago
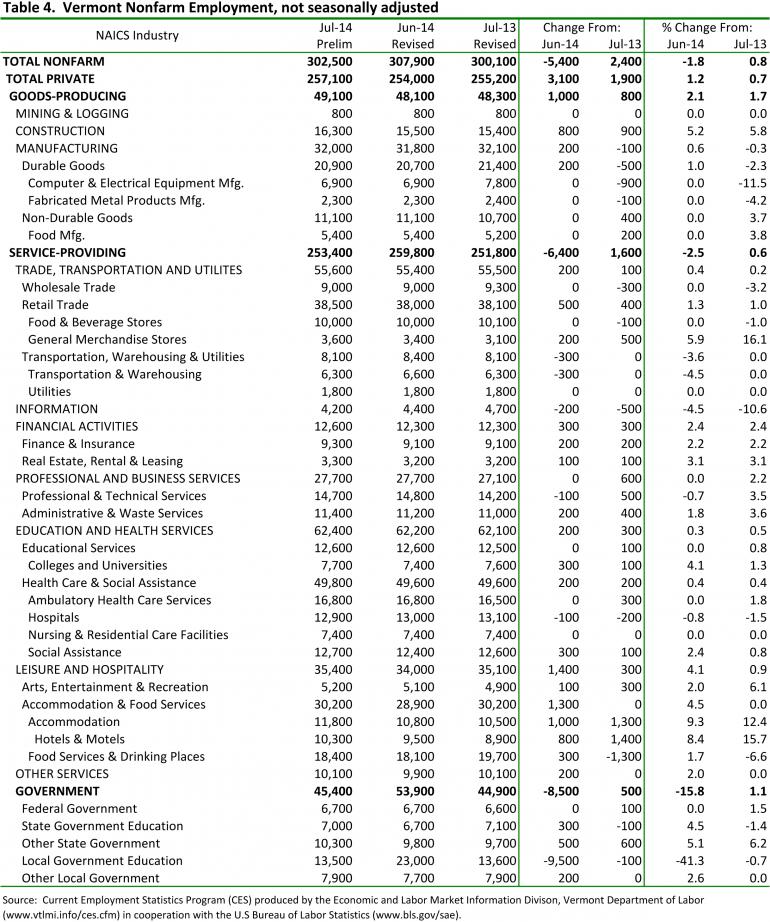
Not Seasonally Adjusted:
The preliminary ‘not-seasonally-adjusted’ jobs estimates for July show a decrease of 5,400 jobs when compared to the revised June numbers. This reported over-the-month change does not include the 400 job increase between the preliminary and the revised June estimates due to the inclusion of more data. The monthly decrease seen in the July numbers was attributable to seasonal decreases related to the Local Government Education industry. The broader economic trends can be detected by focusing on the over-the-year changes in this data series. As detailed in the preliminary ‘not-seasonally-adjusted’ July data, Total Private industries have increased by 0.7 percent (1,900 jobs) and Government employment has increased by 1.1 percent (500 jobs).
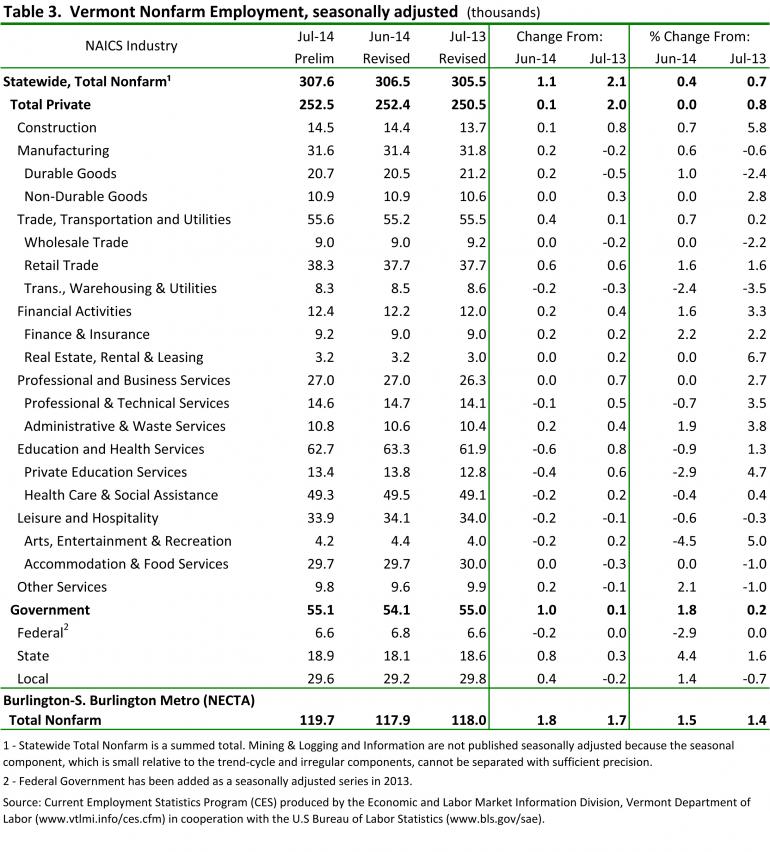
Seasonally Adjusted:
The seasonally adjusted data for July reports an increase of 1,100 jobs from the revised June data. As with the ‘not-seasonally-adjusted’ data, this over-the-month change is from the revised June numbers which experienced a 400 job increase from the preliminary estimates. The seasonally adjusted over-the-month changes in July were minor at the sectorial level. Those with a notable percent increase include: State Government (+800 jobs or +4.4 percent), Other Services (+200 jobs or +2.1 percent) and Financial Activities (+200 jobs or +1.6 percent). Industries with a notable percent decrease include: Federal Government (-200 jobs or -2.9 percent) and Education & Health Services (-600 jobs or -0.9 percent).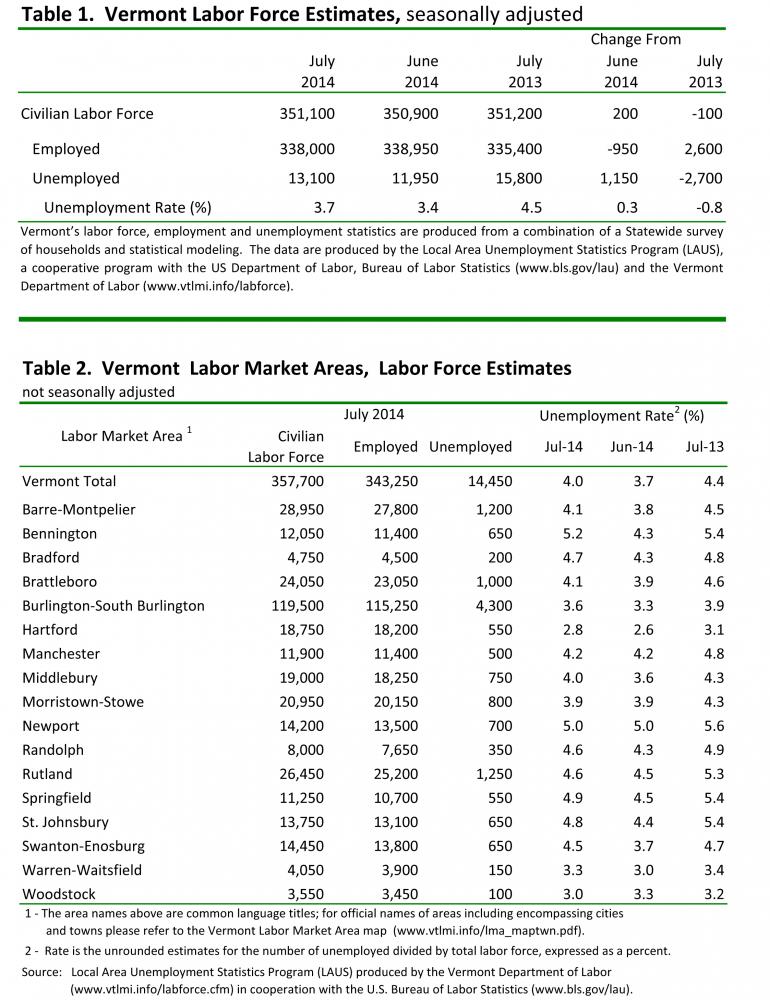
| Unemployment Rates for States Monthly Rankings Seasonally Adjusted July 2014p |
||
|---|---|---|
| Rank | State | Rate |
| 1 | NORTH DAKOTA | 2.8 |
| 2 | NEBRASKA | 3.6 |
| 2 | UTAH | 3.6 |
| 4 | SOUTH DAKOTA | 3.7 |
| 4 | VERMONT | 3.7 |
| 6 | HAWAII | 4.4 |
| 6 | NEW HAMPSHIRE | 4.4 |
| 6 | WYOMING | 4.4 |
| 9 | IOWA | 4.5 |
| 9 | MINNESOTA | 4.5 |
| 11 | MONTANA | 4.6 |
| 11 | OKLAHOMA | 4.6 |
| 13 | IDAHO | 4.8 |
| 14 | KANSAS | 4.9 |
| 15 | TEXAS | 5.1 |
| 16 | COLORADO | 5.3 |
| 17 | LOUISIANA | 5.4 |
| 17 | VIRGINIA | 5.4 |
| 19 | MAINE | 5.5 |
| 20 | MASSACHUSETTS | 5.6 |
| 20 | WASHINGTON | 5.6 |
| 22 | OHIO | 5.7 |
| 22 | PENNSYLVANIA | 5.7 |
| 22 | SOUTH CAROLINA | 5.7 |
| 25 | WISCONSIN | 5.8 |
| 26 | INDIANA | 5.9 |
| 27 | MARYLAND | 6.1 |
| 28 | ARKANSAS | 6.2 |
| 28 | DELAWARE | 6.2 |
| 28 | FLORIDA | 6.2 |
| 31 | WEST VIRGINIA | 6.3 |
| 32 | ALASKA | 6.5 |
| 32 | MISSOURI | 6.5 |
| 32 | NEW JERSEY | 6.5 |
| 32 | NORTH CAROLINA | 6.5 |
| 36 | CONNECTICUT | 6.6 |
| 36 | NEW MEXICO | 6.6 |
| 36 | NEW YORK | 6.6 |
| 39 | ILLINOIS | 6.8 |
| 40 | OREGON | 6.9 |
| 41 | ALABAMA | 7.0 |
| 41 | ARIZONA | 7.0 |
| 43 | TENNESSEE | 7.1 |
| 44 | CALIFORNIA | 7.4 |
| 44 | DISTRICT OF COLUMBIA | 7.4 |
| 44 | KENTUCKY | 7.4 |
| 47 | MICHIGAN | 7.7 |
| 47 | NEVADA | 7.7 |
| 47 | RHODE ISLAND | 7.7 |
| 50 | GEORGIA | 7.8 |
| 51 | MISSISSIPPI | 8.0 |