Vermont Business Magazine Vermont's rural roads are in relatively poor condition, but are also relatively safe, according to a new report based on 2012 data. According to the report by TRIPP, a DC-based industry group that evaluates the nation's surface transportation, America's rural heartland plays a vital role as home to a significant share of the nation’s population, many of its natural resources and popular tourist destinations, and as the primary source of the energy, food and fiber that supports America’s economy and way of life. The strength of the nation’s rural economy relies greatly on the quality of its transportation system, particularly its roadways, which link rural America with the rest of the US and to markets in other countries. The economy of rural America, which supports the quality of life for the approximately 46 million Americans living in rural areas, rides on the quality and connectivity of the rural transportation system. But roads, highways and bridges in the nation’s heartland face a number of significant challenges: they lack adequate capacity, they fail to provide needed levels of connectivity to many communities, they are not built to adequate standards to accommodate growing freight travel in many corridors, rural roads and bridges have significant deficiencies, they lack many desirable safety features, and they experience serious traffic crashes at a rate far higher than all other roads and highways. This report looks at the condition, use and safety of the nation’s rural transportation system, particularly its roads, highways and bridges, and identifies needed improvements.
SEE DATA TABLES ON ROAD CONDITIONS AND FATALITIES BELOW
The following are the key findings of the report.
Rural America plays a vital role as home to a significant share of the nation’s population, natural resources and tourist destinations. It is also the primary source of the energy, food and fiber that drive the U.S. economy.
• Rural America is defined as counties that do not contain an urban area with a population of 50,000 or greater, or counties that lack a large commuting flow to a county containing at least one urban area with a population of 50,000 or greater.
• Rural America is home to approximately 46 million people, accounting for approximately 15 percent of the nation’s population. Rural America contains roughly 72 percent of the land in the U.S. and is home to the vast majority of the nation’s 2.2 million farms.
• The nation’s rural population declined slightly between 2010 and 2012 – a loss of 44,000 residents, or 0.09 percent -- as rural areas recovered from the Great Recession. During this same time period urban America experienced a two percent population increase.
• Population did increase in some rural areas from 2010 to 2012. This population increase occurred primarily in rural counties with significant recreational opportunities, or areas that have been impacted by the ongoing energy boom, particularly in the Northern Great Plains.
• The movement of retiring baby boomers to rural America is likely to continue in the future as aging Americans seek out communities that offer affordable housing, small-town quality of life and desirable natural amenities, while often located within a short drive of larger metropolitan areas.
• Eighty-six percent of trips taken by Americans to visit rural areas are for leisure purposes.
• Popular tourism activities in rural America include hiking, golfing, biking, hunting, fishing and water sports. Rural areas are also home to beaches, national and state parks, wineries, orchards and other national amenities.
• The amount of rural tourism in a region is tied partly to the level of highway access.
The quality of life in America’s small communities and rural areas and the health of the nation’s rural economy is highly reliant on the quality of the nation’s transportation system, particularly its roads, highways and bridges. America’s rural transportation system provides the first and last link in the supply chain from farm to market while supporting the tourism industry and enabling the production of energy, food and fiber.
• The annual value of agricultural production in the U.S. increased by 33 percent from $297 billion in 2007 to $395 billion in 2012.
• While farming accounts for just six percent of all jobs in rural America, for every person employed in farming there are seven more jobs in agribusiness, including wholesale and retail trade, processing, marketing, production, and distribution.
• A United States Department of Agriculture (USDA) report found that “an effective transportation system supports rural economies, reducing the prices farmers pay for inputs such as seeds and fertilizers, raising the value of their crops and greatly increasing market access.”
• Trucks provide the majority of transportation for agricultural products, accounting for 46 percent of total ton miles of travel compared to 36 percent by rail and 12 percent by barge.
• Trucks account for the vast majority of transportation for perishable agricultural items, carrying 91 percent of ton miles of all fruit, vegetables, livestock, meat, poultry and dairy products in the U.S.
• The Council of State Governments recently found that “rural highways provide many benefits to the nation’s transportation system, including serving as a bridge to other states, supporting the agriculture and energy industries, connecting economically challenged citizens in remote locations to employers, enabling the movement of people and freight and providing access to America’s tourist attractions.”
• Transportation is becoming an even more critical segment of the food distribution network. While food demand is concentrated mostly in urban areas, food distribution is the most dispersed segment of the economy.
• A report by the Pacific Economic Cooperation Council recommends that governments improve the quality of their transportation systems serving the movement of goods from rural to urban regions as a strategy to lower food costs and increase economic prosperity.
• A report on agricultural transportation by the USDA found it likely that market changes and shifts in consumer preferences would further increase the reliance on trucking to move U.S. agricultural products.
The condition and quality of the nation’s highway system plays a critical role in providing access to America's many tourist destinations, particularly its scenic parks and recreational areas, which are mostly located in rural areas.
• Travel and tourism related spending in the U.S. in 2013 totaled $1.5 trillion. In 2013, 8.1 million Americans were employed in tourism-related jobs.
• America’s national parks, which are largely located in rural areas, received 274 million visitors in 2013, many in personal vehicles.
Travel loads on America’s rural roads are increasing dramatically due to the booming energy extraction sector. This has been driven by increases in domestic oil and gas extraction, largely as a result of advancements in hydraulic fracturing (fracking), which has greatly increased the accessibility of shale oil and gas deposits, as well as the increased production of renewable energy such as wind and solar.
• Ethanol production in the U.S. increased from 1.7 billion gallons in 2000 to 13.3 billion gallons in 2012. Federal mandates require that production of renewable fuels, including biofuels and cellulosic fuels, reach 36 billion gallons per year by 2022.
• The U.S. production of liquid fuels, including crude oil and natural gas, has increased 34 percent from 2000 to 2014, increasing liquid fuel’s share of overall U.S. energy production, from 47 to 54 percent between 2000 and 2014(includes coal and nuclear).
• The U.S. production of renewable energy, including wind and solar, has increased 48 percent from 2000 to 2014, increasing renewable energy’s share of overall U.S. energy production from 8.3 to 10.6 percent from 2000 and 2014 (includes coal and nuclear).
• The development of significant new oil and gas fields in numerous areas, particularly in the North Central Plains, and increased agricultural production, are placing significantly increased traffic loads by large trucks on non-Interstate rural roads, which often have not been constructed to carry such high load volumes. .
• The average travel per-lane mile by large trucks on major, non-arterial rural roads in the U.S. increased by 16 percent from 2000 to 2012.
Rural Transportation Challenge: Connectivity
![]() The potential for additional economic growth in many rural areas is being impeded by the failure to significantly modernize the nation’s rural transportation system and provide for adequate connectivity. This lack of connectivity is preventing economic growth and reducing quality of life for rural residents.
The potential for additional economic growth in many rural areas is being impeded by the failure to significantly modernize the nation’s rural transportation system and provide for adequate connectivity. This lack of connectivity is preventing economic growth and reducing quality of life for rural residents.
• Sixty-six cities of 50,000 or more in the U.S. do not have direct access to the Interstate Highway System. A list of the 66 cities can be found in Appendix A.
• Since the routes for the Interstate Highway System were designated in 1956, the nation’s population has nearly doubled from - 165 million to 318 million.
• The abandonment of more than 100,000 miles of rail lines in recent decades, mostly in rural areas, has reduced access in many rural communities and increased reliance on trucking for freight movement.
• A report by the American Association of State Highway and Transportation Officials found that connectivity is particularly poor in rural portions of Western states because of the significant distance between Interstate highway routes and the lack of adequate rail service.
• Only 60 percent of rural counties nationwide have public transportation available and 28 percent of those have very limited service.
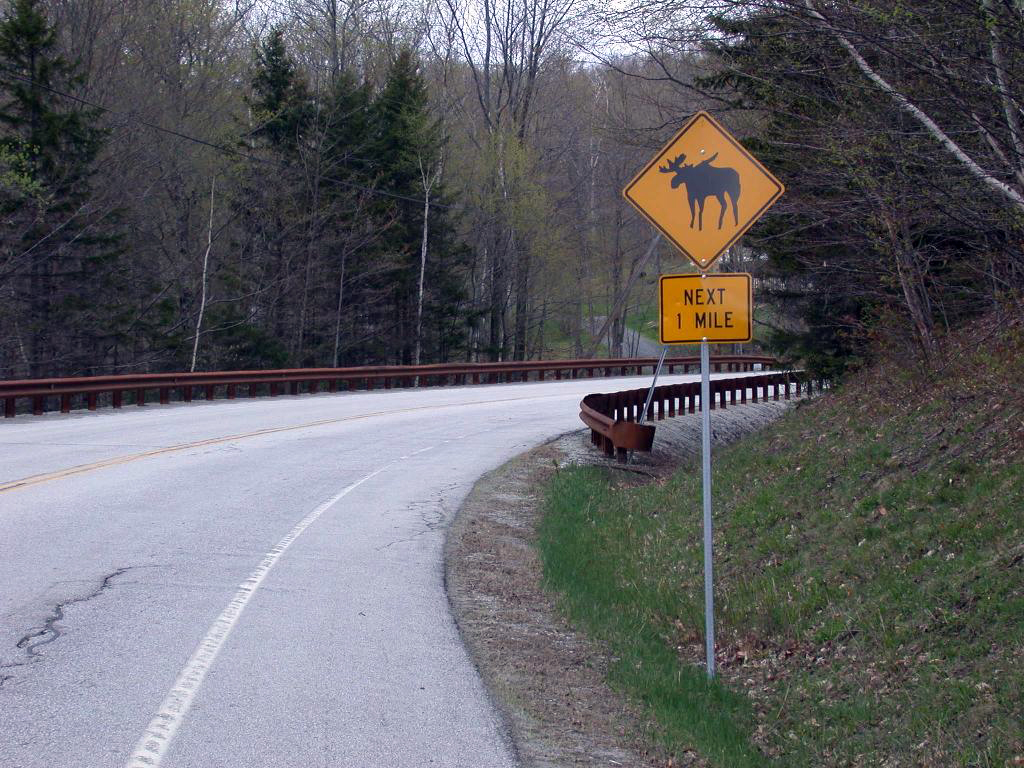
Rural Transportation Challenge: Safety
Traffic fatalities on the nation’s rural roads occur at a rate nearly three times higher than all other roads. A disproportionate share of fatalities take place on rural roads compared to the amount of traffic they carry.
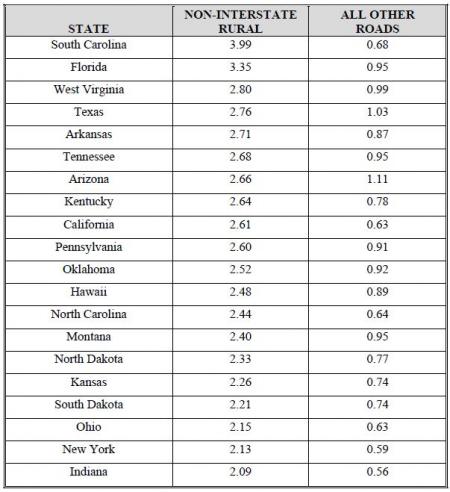
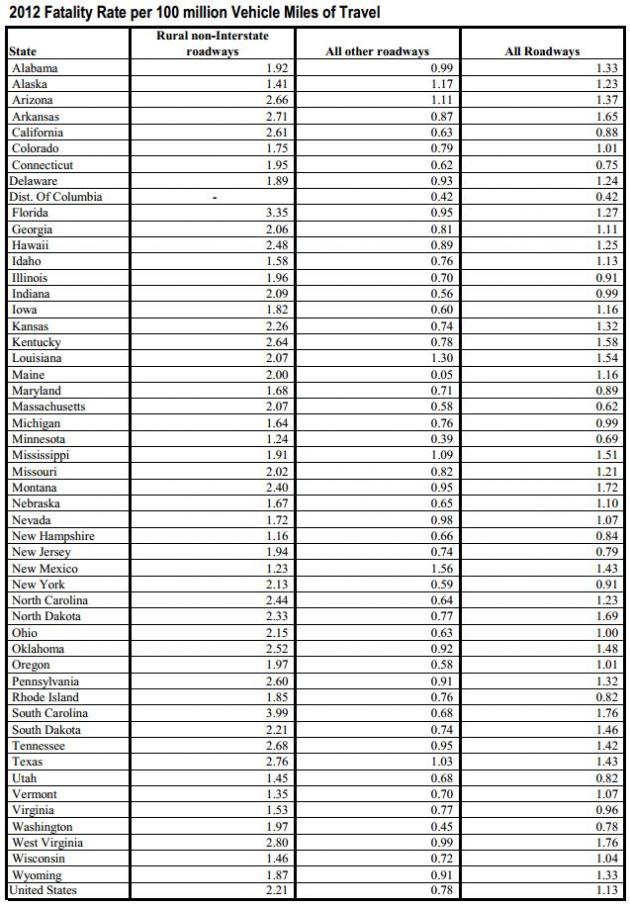
• Rural roads have a traffic fatality rate that is nearly three times higher than all other roads. In 2012, non-Interstate rural roads had a traffic fatality rate of 2.21 deaths for every 100 million vehicle miles of travel, compared to a fatality rate on all other roads of 0.78 deaths per 100 million vehicle miles of travel.
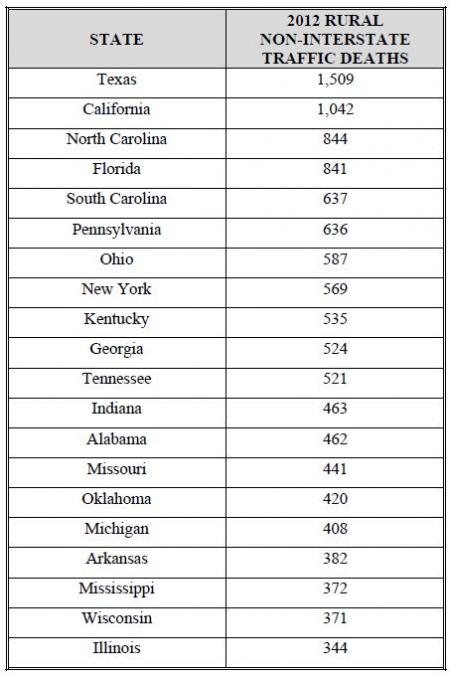
• Crashes on the nation’s rural, non-Interstate routes resulted in 16,161 fatalities in 2012, accounting for nearly half – 48 percent – of the nation’s 33,561 traffic deaths in 2012.
• Rural, non-Interstate routes accounted for 25 percent of all vehicle miles of travel in the U.S. in 2012.
• After years of decreases, the rate of fatalities and the number of fatalities on rural non-Interstate roads increased in 2012. The rate of traffic fatalities on the nation’s rural non-Interstate roads decreased from 2.61 traffic fatalities per 100 million vehicle miles of
travel in 2005 to 2.14 in 2011, before increasing to 2.21 in 2012. Similarly the number of traffic fatalities on the nation’s rural non-Interstate roads decreased from 20,333 in 2005 to 15,668 in 2011 before increasing to 16,161 in 2012.
• While fatality rates on all roads have decreased in recent years, the drop in the fatality rate on rural roads has lagged behind that of all other roads from 2005 to 2012. From 2005 to 2012, the fatality rate on all roads, excluding non-Interstate rural roads, decreased by 26 percent (1.05 fatalities per 100 million vehicle miles of travel to .78). However, during the same timeframe, the traffic fatality rate on rural, non-Interstate routes declined by only 15 percent (2.61 fatalities per 100 vehicle miles of travel to 2.21).
• The chart below shows the twenty states that led the nation in the number of rural non-Interstate traffic deaths in 2012. Data for all states is available in Appendix B.
• The chart below shows the twenty states with the highest rate of rural non-Interstate traffic fatalities per 100 million miles of travel and the fatality rate per 100 million vehicle miles of travel on all other roads in the state in 2012. Data for all states is available in Appendix C.
Inadequate or a lack of desirable roadway safety features, longer emergency vehicle response times and the higher speeds traveled on rural roads compared to urban roads are factors in the higher traffic fatality rate found on rural, non-Interstate routes.
• Rural roads are more likely than urban roads to have roadway features which reduce safety, including narrow lanes, limited shoulders, sharp curves, exposed hazards, pavement drop-offs, steep slopes and limited clear zones along roadsides.
• Because many rural routes have been constructed over a period of years, they often have inconsistent design features for such things as lane widths, curves, shoulders and clearance zones along roadsides.
• Rural roads are more likely than urban roads to be two-lane routes. Seventy percent of the nation’s urban non-freeway arterial and collector roads have two-lanes, compared to 94 percent of rural non-freeway, arterial and collector routes having two-lanes.
• Rural roads are more likely than urban roads to have narrow lanes. A desirable lane width for collector and arterial roadways is at least 11 feet. However, 24 percent of rural collector and arterial roads have lane widths of 10 feet or less, compared to 18 percent of urban collector and arterial roads with lane widths of 10 feet or less.
• Most head-on crashes on rural, non-Interstate roads are likely caused by a motorist making an unintentional maneuver as a result of driver fatigue, being distracted or driving too fast in a curve.
• While driver behavior is a significant factor in traffic crash rates, both safety belt usage and impaired driving rates are similar in their involvement rate as a factor in urban and rural traffic crashes.
Numerous roadway safety improvements can be made to reduce serious crashes and traffic fatalities. These improvements are designed largely to keep vehicles from leaving the correct lane and to reduce the consequences of a vehicle leaving the roadway.
• The type of safety design improvements that are appropriate for a section of rural road will depend partly on the amount of funding available and the nature of the safety problem on that section of road.
• Low-cost safety improvements include installing rumble strips along the centerline and sides of roads, improving signage and pavement/lane markings including higher levels of retroreflectivity, installing lighting, removing or shielding roadside obstacles, using chevrons and post-mounted delineators to indicate roadway alignment along curves, adding skid resistant surfaces at curves and upgrading or adding guardrails.
• Moderate-cost improvements include adding turn lanes at intersections, resurfacing pavements and adding median barriers.
• Moderate to high-cost improvements include improving roadway alignment, reducing the angle of curves, widening lanes, adding or paving shoulders, adding intermittent passing lanes or adding a third or fourth lane.
• Systemic installation of cost effective safety solutions and devices in rural areas helps to improve safety not just by targeting individual safety problem points on a road, but also making entire segments safer by improving those roadway segments that exhibit the characteristics that typically result in fatal or serious-injury crashes.
Rural Transportation Challenge: Deficient Conditions
The nation’s rural roads, highways and bridges have significant deficiencies.
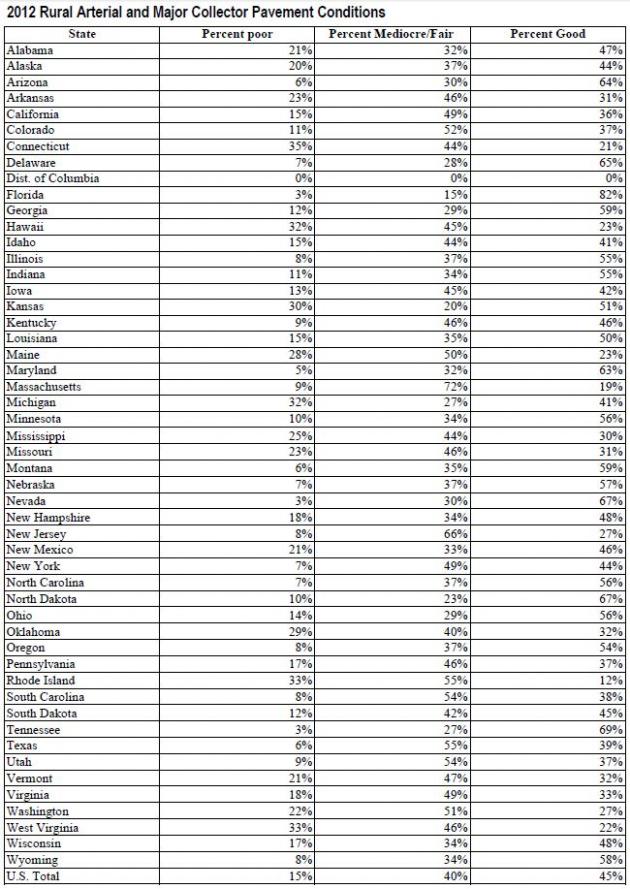
• In 2012, 15 percent of the nation’s major rural roads (arterials and collectors) were rated in poor condition and another 40 percent were rated in fair condition.
• The chart below shows the twenty states with the greatest percentage of major rural roads in poor condition in 2012. Rural pavement conditions for all states can be found in Appendix D.
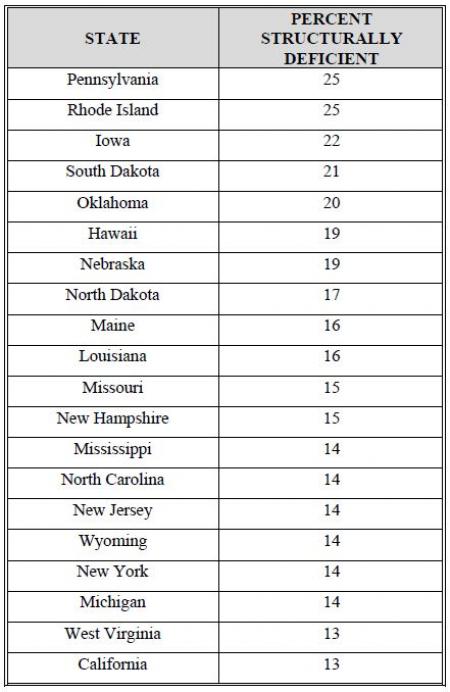
 • In 2013, 12 percent of the nation’s rural bridges were rated as structurally deficient. A bridge is structurally deficient if there is significant deterioration of the bridge deck,
supports or other major components. Structurally deficient bridges are often posted for lower weight or closed to traffic, restricting or redirecting large vehicles, including commercial trucks, school buses and emergency services vehicles.
• In 2013, 10 percent of the nation’s rural bridges were rated as functionally obsolete. Bridges that are functionally obsolete no longer meet current highway design standards, often because of narrow lanes, inadequate clearances or poor alignment.
• The chart below shows the twenty states with the highest share of rural bridges rated structurally deficient in 2013. Rural bridge conditions for all states can be found in Appendix E.
Transportation Opportunities in Rural America
see full report
America must adopt transportation policies that improve rural transportation connectivity, safety and conditions to provide the nation's small communities and rural areas with a level of safe and efficient access that will support quality of life and enhance economic productivity.
The following recommendations by TRIP for an improved rural transportation system are also based partially on findings and recommendations made by the American Association of State Highway and Transportation Officials (AASHTO), the National Highway Cooperative Research Program (NCHRP), the Council of State Governments (CSG) and the Ports-to-Plains Alliance.
Improve access and connectivity in America’s small communities and rural areas
- Widen and extend key highway routes, including Interstates, to increase connectivity to smaller and emerging communities to facilitate access to jobs, education and healthcare while improving access for agriculture, energy, manufacturing, forestry, tourism and other critical segments of the rural economy.
- The NCHRP report found that the construction of an additional 30,000 lane miles of limited access highways, largely along existing corridors, is needed to address the nation’s need for increased rural connectivity.
- Modernize major two-lane roads and highways so they can accommodate increased personal and commercial travel.
- Improve public transit service in rural America to provide improved mobility for people without access to private vehicles.
Improve rural traffic safety
- Adequately fund needed rural roadway safety improvements and provide enhanced enforcement, education and improved emergency response to reduce the rate of rural traffic fatalities.
- Implement cost-effective roadway safety improvements, including rumble strips, shoulder improvements, lane widening, curve reductions, skid resistant surfaces at curves, passing lanes, intersection improvements and improved signage, pavement markings and lighting, guardrails and barriers, and improved shielding of obstacles.
Improve the condition of rural roads, highways and bridges
- Adequately fund local and state transportation programs to insure sufficient preservation of rural roads, highways and bridges to maintain transportation service and accommodate large truck travel, which is needed to support the rural economy.
The federal government is a critical source of funding for rural roads, highways and bridges. However, current federal transportation funding will expire on September 30, 2014.
• MAP-21(Moving Ahead for Progress in the 21st Century Act), approved by Congress in July 2012, increased funding flexibility for states and streamlined project approval processes to improve the efficiency of state and local transportation agencies in providing needed transportation improvements.
• MAP-21, which expires on September 30, 2014, does not provide sufficient long-term revenues to support the current level of federal surface transportation investment.
• The impact of inadequate federal surface transportation revenues could be felt as early as this summer, when federal funding for road, highway and bridge projects is likely to be delayed because the balance in the Highway Account of the federal Highway Trust Fund is expected to drop below $1 billion. This delay and uncertainty in funding will likely result in the postponement of numerous projects.
• Nationwide federal funding for highways is expected to be cut by almost 100 percent from the current investment level for the fiscal year starting October 1, 2014 (FY 2015) unless Congress provides additional transportation revenues. This is due to a cash shortfall in the Highway Trust Fund as projected by the Congressional Budget Office.
• If Congress decides to provide additional revenues into the federal Highway Trust Fund in tandem with authorizing a new federal surface transportation program, a number of technically feasible revenue options have been identified by the American Association of State Highway and Transportation Officials.
The chief executive officer of the Associated General Contractors of America, Stephen E. Sandherr, released the following statement in response to a report on the condition of the nation’s rural roads released by national transportation research group TRIP today. The report found that the rural road fatality rate is three times higher than all other roads, while 15 percent of rural roads are in poor shape and 22 percent of rural bridges are either structurally deficient or functionally obsolete:
“As this report makes clear, Washington’s failure to adequately fund repairs to our aging network of roads and bridges is having an even worse impact on our rural roads than the rest of our transportation system. And while these rural roads may not be the ones most commuters use on a daily basis, they play a vital role in assuring the movement of hundreds of billions of dollars worth of agricultural, energy and manufacturing products every day. Neglecting our rural road network needlessly risks lives and forces shipping delays that inflate the cost of fuel, groceries and countless other essential consumer products.
“Even as our nationwide network of roads and bridges continues to age and deteriorate, the U.S. Department of Transportation is warning states it will begin cutting back federal funding for highway projects in August as the balance in the federal Highway Trust Fund approaches dangerously low levels. The mere threat of this funding slowdown has already prompted many states to reduce the number of road and bridge repair projects they undertake this year. Allowing such a federal funding slowdown will lead to even worse road conditions and put more road users at risk.
“Congress and the Obama administration must work together to address declining Highway Trust Fund revenues and bring all our roads and bridges back to a state of good repair. That is why our members will continue to use the Hardhats for Highways campaign to contact their elected officials and urge them to act quickly to fully fund highway and bridge repairs and pass a long-term surface transportation bill this year.”
 Source: TRIP 7.10.2014 Founded in 1971, TRIP of Washington, DC, is a nonprofit organization that researches, evaluates and distributes economic and technical data on surface transportation issues. TRIP is sponsored by insurance companies, equipment manufacturers, distributors and suppliers; businesses involved in highway and transit engineering and construction; labor unions; and organizations concerned with efficient and safe surface transportation. All data used in this report is the most current available. Sources of information for this report include: The Federal Highway Administration (FHWA), the National Highway Traffic Safety Administration (NHTSA), the National Cooperative Highway Research Program (NCHRP), the American Association of State Highway and Transportation Officials(AASHTO), the United States Department of Agriculture (USDA), the Council of State Governments (CSG) and the U.S. Census Bureau.
PHOTOS courtesy of VTrans.