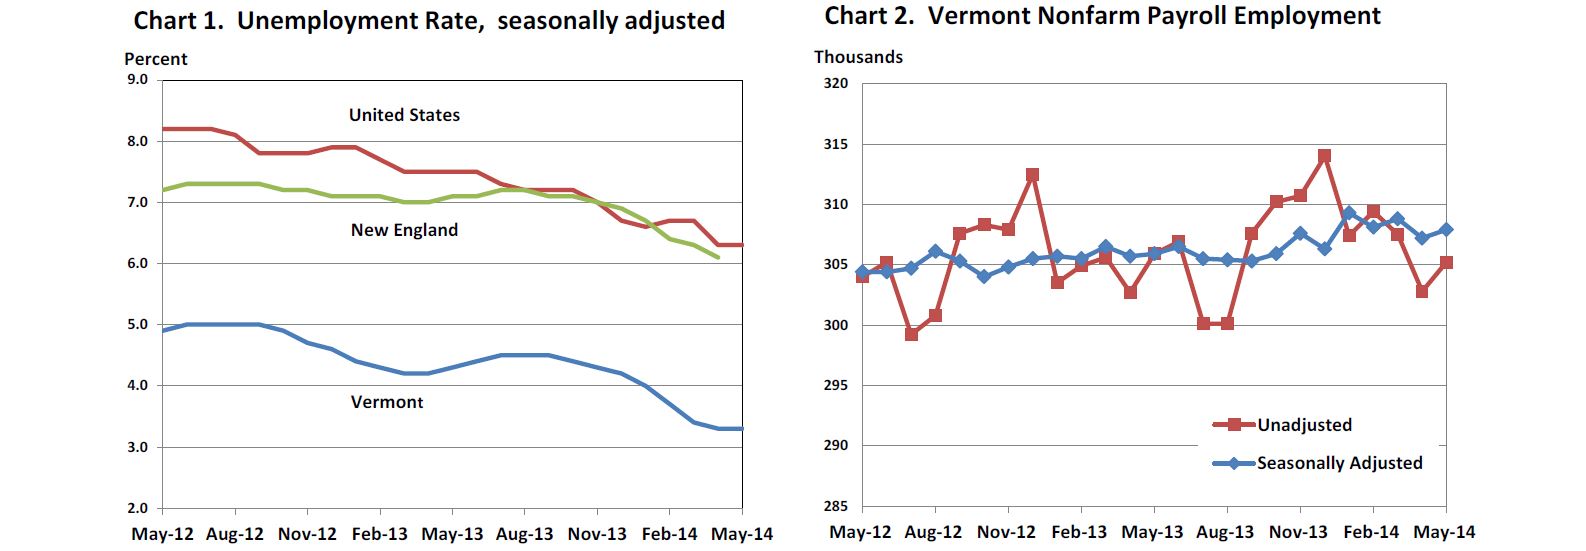
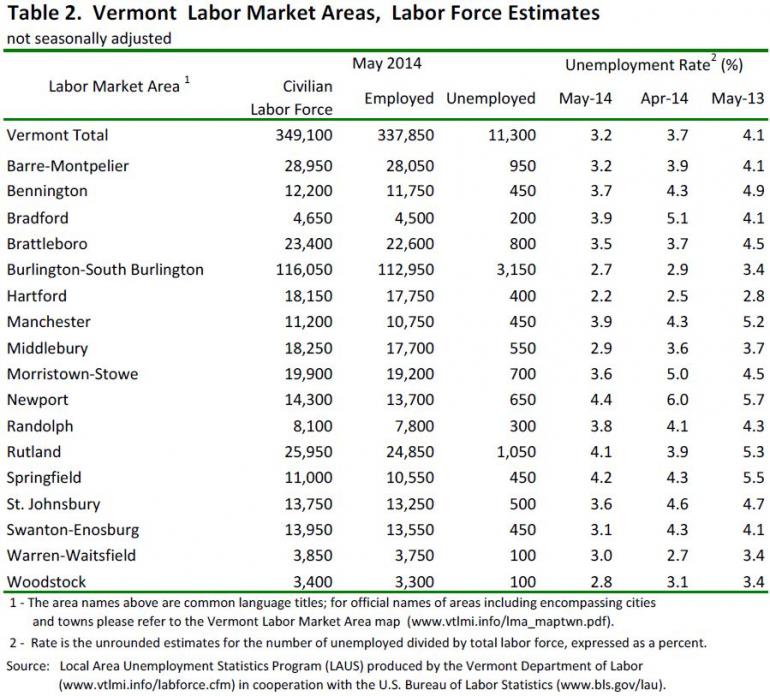
Vermont Business Magazine The Vermont jobless rate, the number of employed and unemployed, and the total labor force stayed remarkably the same in May relative to the April numbers. The Vermont Department of Labor announced today that the seasonally-adjusted statewide unemployment rate for May 2014 was 3.3 percent. This represents no change from the previously reported April rate. The equivalent national average was 6.3 percent, which also held steady from the previous month’s estimate. By not declining, May 2014 data ends a streak of seven consecutive months of reported decreases to the statewide unemployment rate in Vermont. As of the prior month’s initial data, Vermont’s unemployment rate remains the second lowest in the country. The seasonally adjusted Vermont data for May show the Vermont civilian labor force increased by 250 from the prior month estimates. The number of employed increased by 200 and the number of unemployed increased by 50. None of the over-the-month changes to the seasonally-adjusted estimates were statistically significant. However, most of the year-over-year data, with the exception of total labor force, show marked improvement, with job gains, fewer jobless and a commensurate drop in the unemployment rate.
 “This month’s rate was unchanged despite some staff reductions by several companies. The flip side has been increased hiring by some of Vermont’s large employers such as GMCR/Keurig, Dealer.com and Cabot Cheese. We note that the state’s unemployment rate during the past few summers has reflected brief periods of upward pressure, and then has usually quickly leveled out or reduced. The Department has great programs to reconnect people to the workforce –building up programs and services for dislocated and trade adjusted workers, long-term unemployed, veterans, youth and senior populations. Our local Career Resource office staff are available to connect Vermonters to jobs, training and other resources. We want to ensure that Vermont has opportunities for career and personal growth for all workers and those seeking to enter the workforce,” said Labor Commissioner Annie Noonan.
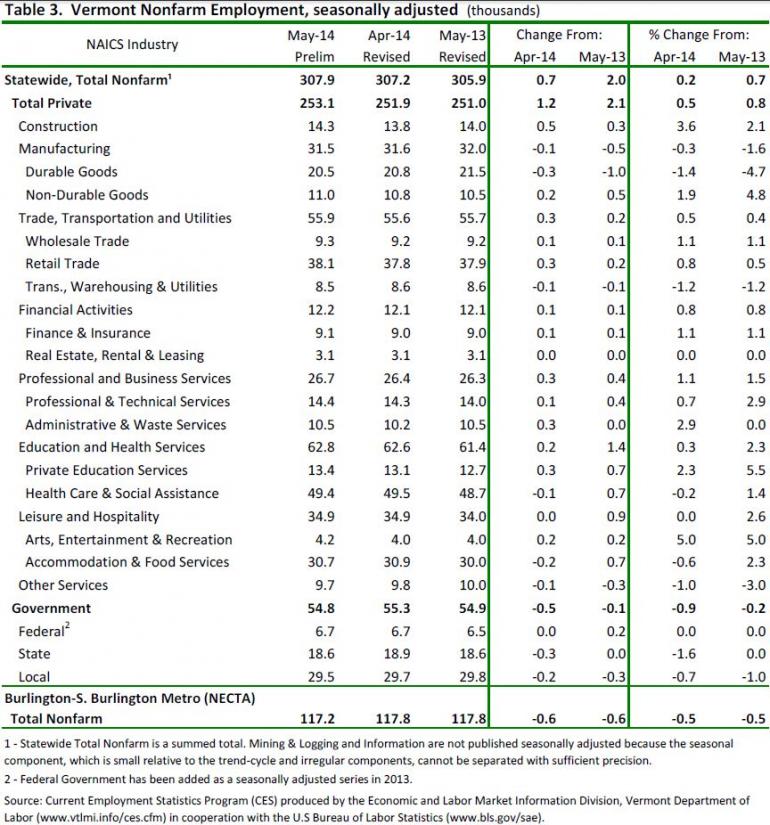
May unemployment rates for Vermont’s 17 labor market areas ranged from 2.2 percent in Hartford to 4.4 percent in Newport (note: local labor market area unemployment rates are not seasonally adjusted; SEE Labor Market and Industry Tables Below AND Nationwide Rates by State). For comparison, the May unadjusted unemployment rate for Vermont was 3.2 percent which reflects a decrease of five-tenths of a percent from the April level and a decline of nine-tenths of a percent from a year ago
Not Seasonally Adjusted
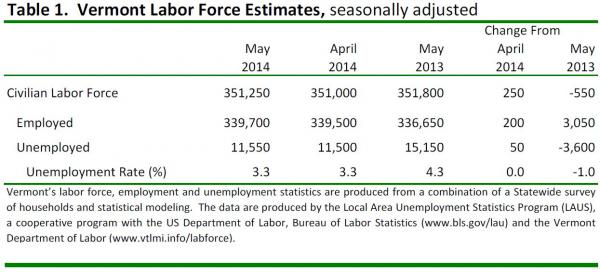
The preliminary ‘not-seasonally-adjusted’ jobs estimates for May show an increase of 2,400 jobs when compared to the revised April numbers. This reported over-the-month change does not include the 1,700 job decrease between the preliminary and the revised April estimates due to the inclusion of more data. The monthly increase seen in the May numbers was attributable to seasonal increases related to Construction. The broader economic trends can be detected by focusing on the over-the-year changes in this data series. As detailed in the preliminary ‘not-seasonally-adjusted’ May data, Total Private industries have increased by 0.4 percent (1,000 jobs) and Government employment has decreased by 2.9 percent (1,700 jobs).
Seasonally Adjusted
The seasonally adjusted data for May reports an increase of 700 jobs from the revised April data. As with the ‘not-seasonally-adjusted’ data, this over-the-month change is from the revised April numbers which experienced a 1,700 job decrease from the preliminary estimates. The seasonally adjusted over-the-month changes in May were minor at the sectorial level. Those with a notable percent increase include: Construction (+500 jobs or +3.6 percent) and Professional and Business Services (+300 jobs or +1.1 percent). Industries with a notable percent decrease include: State Government (-300 jobs or -1.6 percent) and Other Services (-100 jobs or -1.0 percent).
Unemployment Rates for States
| Unemployment Rates for States Monthly Rankings Seasonally Adjusted May 2014p |
||
|---|---|---|
| Rank | State | Rate |
| 1 | NORTH DAKOTA | 2.6 |
| 2 | VERMONT | 3.3 |
| 3 | NEBRASKA | 3.6 |
| 3 | UTAH | 3.6 |
| 5 | SOUTH DAKOTA | 3.8 |
| 5 | WYOMING | 3.8 |
| 7 | HAWAII | 4.4 |
| 7 | IOWA | 4.4 |
| 7 | NEW HAMPSHIRE | 4.4 |
| 10 | MINNESOTA | 4.6 |
| 10 | MONTANA | 4.6 |
| 10 | OKLAHOMA | 4.6 |
| 13 | KANSAS | 4.8 |
| 14 | IDAHO | 4.9 |
| 14 | LOUISIANA | 4.9 |
| 16 | TEXAS | 5.1 |
| 16 | VIRGINIA | 5.1 |
| 18 | SOUTH CAROLINA | 5.3 |
| 19 | OHIO | 5.5 |
| 20 | MARYLAND | 5.6 |
| 20 | MASSACHUSETTS | 5.6 |
| 20 | PENNSYLVANIA | 5.6 |
| 23 | INDIANA | 5.7 |
| 23 | MAINE | 5.7 |
| 23 | WISCONSIN | 5.7 |
| 26 | COLORADO | 5.8 |
| 27 | DELAWARE | 5.9 |
| 28 | WASHINGTON | 6.1 |
| 29 | FLORIDA | 6.3 |
| 29 | WEST VIRGINIA | 6.3 |
| 31 | ALASKA | 6.4 |
| 31 | ARKANSAS | 6.4 |
| 31 | NORTH CAROLINA | 6.4 |
| 31 | TENNESSEE | 6.4 |
| 35 | NEW MEXICO | 6.5 |
| 36 | MISSOURI | 6.6 |
| 37 | NEW YORK | 6.7 |
| 38 | ALABAMA | 6.8 |
| 38 | ARIZONA | 6.8 |
| 38 | NEW JERSEY | 6.8 |
| 41 | CONNECTICUT | 6.9 |
| 41 | OREGON | 6.9 |
| 43 | GEORGIA | 7.2 |
| 44 | DISTRICT OF COLUMBIA | 7.5 |
| 44 | ILLINOIS | 7.5 |
| 44 | MICHIGAN | 7.5 |
| 47 | CALIFORNIA | 7.6 |
| 48 | KENTUCKY | 7.7 |
| 48 | MISSISSIPPI | 7.7 |
| 50 | NEVADA | 7.9 |
| 51 | RHODE ISLAND | 8.2 |
p= preliminary.
NOTE: Rates shown are a percentage of the labor force. Data refer to place of residence. Estimates for the current month are subject to revision the following month.
Last Modified Date:June 20, 2014
Source: VT DOL; US DOL 6.20.2014. The Unemployment and Jobs Report for June is scheduled to be released on Friday, July 18, 2014 at 10 am. GRAPHS show the NONFARM Employment and the Vermont employment rate relative to regional and national results. Nonfarm payroll employment is a count of the number of nonagricultural jobs, rather than the number of persons actually employed.