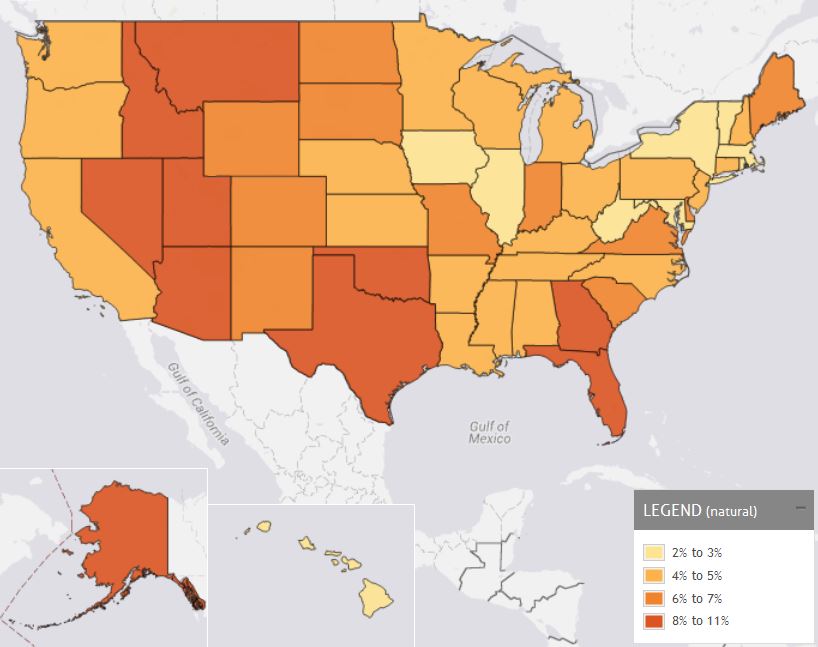
Vermont Business Magazine Vermont has risen to the top spot, tied with Massachusetts and the District of Columbia, in health insurance coverage for children, covering all but 2 percent of children for 2014. DC has the fewest in number with 2,000, while Vermont has the fewest among the states with 3,000 children uninsured. Massachusetts and DC ranked first in 2013 with 2 percent, while Vermont was tied for third with 3 percent, according to the KIDS COUNT Child Well-Being Index from the Annie E Casey Foundation. Alaska and Texas have the highest percentages (11 percent). Texas has the most in number with 784,000 children uninsured, but down by more than a 100,000. California is second worst in number with 497,000 (5 percent), which is a drop of nearly 200,000 from 2013. Only Virginia saw an increase (5 to 6 percent ) to 107,000.
From 2008 to 2014, the number of uninsured children in America (under age 18 not covered by any health insurance) fell by 40 percent —from 7.3 million to 4.4 million.During this same time frame, the percentage of kids without health insurance fell across all racial and ethnic categories. Three groups — blacks, Latinos and American Indians — experienced the most dramatic drops on this front.
 Despite these improvements, 14 percent of American Indian kids and 10 percent of Latino kids still lacked health insurance in 2014. Children from these two groups were also more likely to be uninsured relative to peers of other racial and ethnic groups. Experts attribute the overall, extended drop in uninsured rates among kids to expanded public health coverage. At the same time, employer-sponsored health insurance remains elusive for many low-wage and part-time adult workers in America, and full-time workers have also seen substantial cuts in employer-sponsored health insurance benefits, according to recent research.
Children without health insurance coverage are less likely than insured children to have a regular health care provider and to receive care when they need it. They are also more likely to receive treatment after their condition has worsened, putting them at greater risk of hospitalization. Having health insurance can protect families from financial devastation when a child experiences a serious or chronic illness.
| Location | Data Type | 2010 | 2011 | 2012 | 2013 | 2014 |
|---|---|---|---|---|---|---|
| Alabama | Number | 67,000 | 59,000 | 46,000 | 48,000 | 42,000 |
| Percent | 6% | 5% | 4% | 4% | 4% | |
| Alaska | Number | 23,000 | 22,000 | 26,000 | 22,000 | 21,000 |
| Percent | 12% | 12% | 14% | 12% | 11% | |
| Arizona | Number | 208,000 | 208,000 | 214,000 | 192,000 | 162,000 |
| Percent | 13% | 13% | 13% | 12% | 10% | |
| Arkansas | Number | 46,000 | 40,000 | 42,000 | 39,000 | 34,000 |
| Percent | 7% | 6% | 6% | 6% | 5% | |
| California | Number | 833,000 | 745,000 | 730,000 | 673,000 | 497,000 |
| Percent | 9% | 8% | 8% | 7% | 5% | |
| Colorado | Number | 124,000 | 116,000 | 109,000 | 102,000 | 70,000 |
| Percent | 10% | 9% | 9% | 8% | 6% | |
| Connecticut | Number | 24,000 | 23,000 | 30,000 | 34,000 | 29,000 |
| Percent | 3% | 3% | 4% | 4% | 4% | |
| Delaware | Number | 11,000 | 9,000 | 7,000 | 9,000 | 12,000 |
| Percent | 5% | 5% | 4% | 4% | 6% | |
| District of Columbia | Number | 2,000 | 4,000 | 2,000 | 3,000 | 2,000 |
| Percent | 2% | 4% | 2% | 2% | 2% | |
| Florida | Number | 507,000 | 475,000 | 436,000 | 445,000 | 378,000 |
| Percent | 13% | 12% | 11% | 11% | 9% | |
| Georgia | Number | 244,000 | 237,000 | 220,000 | 238,000 | 189,000 |
| Percent | 10% | 10% | 9% | 10% | 8% | |
| Hawaii | Number | 11,000 | 11,000 | 10,000 | 9,000 | 10,000 |
| Percent | 4% | 4% | 3% | 3% | 3% | |
| Idaho | Number | 45,000 | 39,000 | 36,000 | 38,000 | 34,000 |
| Percent | 11% | 9% | 8% | 9% | 8% | |
| Illinois | Number | 140,000 | 113,000 | 101,000 | 125,000 | 100,000 |
| Percent | 4% | 4% | 3% | 4% | 3% | |
| Indiana | Number | 143,000 | 129,000 | 134,000 | 130,000 | 113,000 |
| Percent | 9% | 8% | 8% | 8% | 7% | |
| Iowa | Number | 29,000 | 32,000 | 29,000 | 30,000 | 23,000 |
| Percent | 4% | 4% | 4% | 4% | 3% | |
| Kansas | Number | 60,000 | 46,000 | 48,000 | 44,000 | 39,000 |
| Percent | 8% | 6% | 7% | 6% | 5% | |
| Kentucky | Number | 61,000 | 62,000 | 56,000 | 60,000 | 43,000 |
| Percent | 6% | 6% | 6% | 6% | 4% | |
| Louisiana | Number | 62,000 | 65,000 | 59,000 | 63,000 | 58,000 |
| Percent | 6% | 6% | 5% | 6% | 5% | |
| Maine | Number | 11,000 | 14,000 | 12,000 | 15,000 | 16,000 |
| Percent | 4% | 5% | 5% | 6% | 6% | |
| Maryland | Number | 64,000 | 61,000 | 51,000 | 59,000 | 43,000 |
| Percent | 5% | 5% | 4% | 4% | 3% | |
| Massachusetts | Number | 22,000 | 24,000 | 20,000 | 21,000 | 21,000 |
| Percent | 2% | 2% | 1% | 2% | 2% | |
| Michigan | Number | 95,000 | 94,000 | 90,000 | 90,000 | 83,000 |
| Percent | 4% | 4% | 4% | 4% | 4% | |
| Minnesota | Number | 84,000 | 80,000 | 68,000 | 72,000 | 49,000 |
| Percent | 7% | 6% | 5% | 6% | 4% | |
| Mississippi | Number | 64,000 | 61,000 | 55,000 | 56,000 | 39,000 |
| Percent | 8% | 8% | 7% | 8% | 5% | |
| Missouri | Number | 88,000 | 95,000 | 98,000 | 98,000 | 100,000 |
| Percent | 6% | 7% | 7% | 7% | 7% | |
| Montana | Number | 28,000 | 26,000 | 24,000 | 22,000 | 18,000 |
| Percent | 12% | 12% | 11% | 10% | 8% | |
| Nebraska | Number | 26,000 | 27,000 | 28,000 | 25,000 | 25,000 |
| Percent | 6% | 6% | 6% | 5% | 5% | |
| Nevada | Number | 115,000 | 107,000 | 110,000 | 99,000 | 64,000 |
| Percent | 17% | 16% | 17% | 15% | 10% | |
| New Hampshire | Number | 14,000 | 10,000 | 11,000 | 10,000 | 12,000 |
| Percent | 5% | 4% | 4% | 4% | 4% | |
| New Jersey | Number | 123,000 | 105,000 | 103,000 | 112,000 | 92,000 |
| Percent | 6% | 5% | 5% | 6% | 5% | |
| New Mexico | Number | 53,000 | 47,000 | 41,000 | 43,000 | 36,000 |
| Percent | 10% | 9% | 8% | 9% | 7% | |
| New York | Number | 208,000 | 181,000 | 168,000 | 171,000 | 138,000 |
| Percent | 5% | 4% | 4% | 4% | 3% | |
| North Carolina | Number | 177,000 | 175,000 | 173,000 | 144,000 | 119,000 |
| Percent | 8% | 8% | 8% | 6% | 5% | |
| North Dakota | Number | 10,000 | 10,000 | 11,000 | 13,000 | 12,000 |
| Percent | 6% | 6% | 7% | 8% | 7% | |
| Ohio | Number | 162,000 | 157,000 | 141,000 | 141,000 | 126,000 |
| Percent | 6% | 6% | 5% | 5% | 5% | |
| Oklahoma | Number | 93,000 | 99,000 | 94,000 | 95,000 | 82,000 |
| Percent | 10% | 11% | 10% | 10% | 9% | |
| Oregon | Number | 76,000 | 63,000 | 55,000 | 50,000 | 39,000 |
| Percent | 9% | 7% | 6% | 6% | 5% | |
| Pennsylvania | Number | 144,000 | 149,000 | 139,000 | 147,000 | 139,000 |
| Percent | 5% | 5% | 5% | 5% | 5% | |
| Rhode Island | Number | 12,000 | 9,000 | 10,000 | 12,000 | 7,000 |
| Percent | 6% | 4% | 5% | 5% | 3% | |
| South Carolina | Number | 102,000 | 91,000 | 89,000 | 73,000 | 60,000 |
| Percent | 9% | 8% | 8% | 7% | 6% | |
| South Dakota | Number | 17,000 | 12,000 | 12,000 | 13,000 | 12,000 |
| Percent | 8% | 6% | 6% | 6% | 6% | |
| Tennessee | Number | 79,000 | 85,000 | 85,000 | 85,000 | 78,000 |
| Percent | 5% | 6% | 6% | 6% | 5% | |
| Texas | Number | 996,000 | 917,000 | 863,000 | 888,000 | 784,000 |
| Percent | 14% | 13% | 12% | 13% | 11% | |
| Utah | Number | 95,000 | 97,000 | 90,000 | 85,000 | 85,000 |
| Percent | 11% | 11% | 10% | 9% | 9% | |
| Vermont | Number | 3,000 | 3,000 | 3,000 | 4,000 | 3,000 |
| Percent | 2% | 2% | 3% | 3% | 2% | |
| Virginia | Number | 121,000 | 108,000 | 104,000 | 101,000 | 107,000 |
| Percent | 7% | 6% | 6% | 5% | 6% | |
| Washington | Number | 102,000 | 97,000 | 91,000 | 95,000 | 75,000 |
| Percent | 6% | 6% | 6% | 6% | 5% | |
| West Virginia | Number | 18,000 | 17,000 | 15,000 | 20,000 | 11,000 |
| Percent | 5% | 4% | 4% | 5% | 3% | |
| Wisconsin | Number | 67,000 | 58,000 | 62,000 | 61,000 | 58,000 |
| Percent | 5% | 4% | 5% | 5% | 4% | |
| Wyoming | Number | 11,000 | 12,000 | 13,000 | 8,000 | 8,000 |
| Percent | 8% | 9% | 9% | 6% | 6% |
This indicator is included in the KIDS COUNT Child Well-Being Index. Read the KIDS COUNT Data Book to learn more: http://datacenter.kidscount.org/publications.
Definitions: Children under age 18 not covered by any health insurance.
The data are based on health insurance coverage at the time of the survey; interviews are conducted throughout the calendar year. Children receiving health insurance through a variety of State Health Insurance Programs (SCHIP) are counted as having health insurance.
Data Source: Population Reference Bureau, analysis of data from the U.S. Census Bureau, 2008-2014 American Community Survey.
These data are derived from data available in American Fact Finder table C27001 (factfinder2.census.gov).
Footnotes: Updated September 2015.
S - Estimates suppressed when the confidence interval around the percentage is greater than or equal to 10 percentage points.
N.A. – Data not available.
A 90 percent confidence interval for each estimate can be found at Children without health insurance.
Source: Annie E. Casey Foundation 10.27.2015