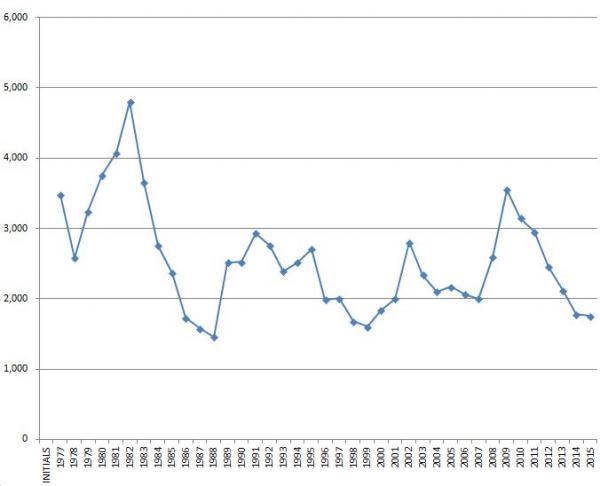
Vermont Business MagazineWeekly unemployment claims in Vermont last week fell below 300 for the first time in memory. Claims are running at their lowest levels since 1999. The graph below shows total August claims since 1977 (historic weekly data not available). The graph also indicates how severe the two major recessions were during this period, with the recession of the early 1980s far exceeding in Vermont the Great Recession of 2008-2009. The worst months during this 38-year period were December 1981 with 9,369 initial claims and December 1982, with 9,592. The next worst was December 2001, with 9,173 claims, following the downturn caused by the 9/11 attacks. The worst month during the Great Recession was 8,636 in December 2008. December 2014 had 6,637 claims.
 For the week of September 26, there were 286 new, regular benefit claims for Unemployment Insurance in Vermont, a decrease of 23 from the previous week's total and 74 fewer than they were a year ago. Generally, claims have been running below last year's totals. Total claims were down in most regions of the state. By industry, claims fell in manufacturing but otherwise held steady with very low totals. As has been the trend, Services led all categories with 48 percent of all claims.
Altogether 3,056 new and continuing claims were filed, a decrease of 90 from a week ago, and 448 fewer than a year ago.
Monthly Claims for August 1977-2015
 The Department processed 0 First Tier claims for benefits under Emergency Unemployment Compensation, 2008 (EUC08). The total for all programs was 3,056 claims, 90 fewer than last week, and 450 fewer than the same time last year.
For the week by industry, Services claims were about the same in number and as a percentage same fromthe prior week and still represent the preponderance of claims for any one sector, at 48 percent of all claims. Manufacturing claims were down after a spike earlier in September.
By region, Total Claims in nearly every region of the state were down for the week and mostly down from last year.
The Unemployment Weekly Report can be found at:http://www.vtlmi.info/. Previously released Unemployment Weekly Reports and other UI reports can be found at:http://www.vtlmi.info/lmipub.htm#uc
Vermont's unemployment rate held at 3.6 percent in August, as total employment fell and unemployment was up, but the total labor market was also down.SEESTORY.
NOTE: Employment (nonfarm payroll)- A count of all persons who worked full- or part-time or received pay from a nonagricultural employer for any part of the pay period which included the 12th of the month. Because this count comes from a survey of employers, persons who work for two different companies would be counted twice. Therefore, nonfarm payroll employment is really a count of the number of jobs, rather than the number of persons employed. Persons may receive pay from a job if they are temporarily absent due to illness, bad weather, vacation, or labor-management dispute. This count is based on where the jobs are located, regardless of where the workers reside, and is therefore sometimes referred to as employment "by place of work." Nonfarm payroll employment data are collected and compiled based on the Current Employment Statistics (CES) survey, conducted by the Vermont Department of Labor. This count was formerly referred to as nonagricultural wage and salary employment.

