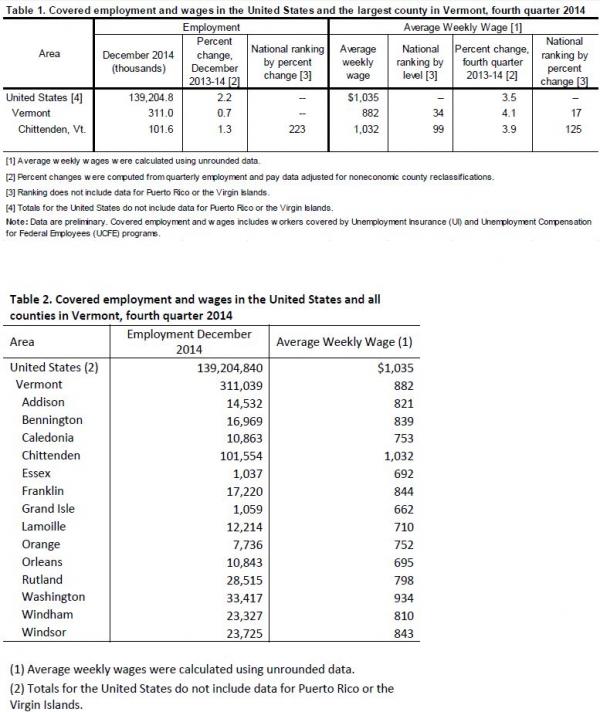
Vermont Business Magazine Employment in Vermont’s only large county, Chittenden, increased 1.3 percent from December 2013 to December 2014, the US Bureau of Labor Statistics reported Tuesday. All 13 smaller counties in Vermont had average weekly wages below the national average. Regional Commissioner Deborah A Brown noted that the average weekly wage in Chittenden County rose 3.9 percent from the fourth quarter of 2013 to the fourth quarter of 2014, to $1,032. The US average was 3.5 percent. Nationally, employment increased 2.2 percent from December 2013 to December 2014, as 319 of the 339 largest counties registered increases.
Employment in Chittenden County was 101,554 in December 2014, accounting for 32.6 percent of employment statewide. Nationwide, the 339 largest counties accounted for 72.1 percent of total US employment.
Weld, CO, and Midland, TX, had the largest percentage increases, each with gains of 8.0 percent over the year. Atlantic, NJ, had the largest over-the-year decrease in employment among the large US counties with a loss of 5.0 percent.
Employment and wage levels (but not over-the-year changes) are also available for the 13 counties in Vermont with employment below 75,000.
Large County Wage Changes
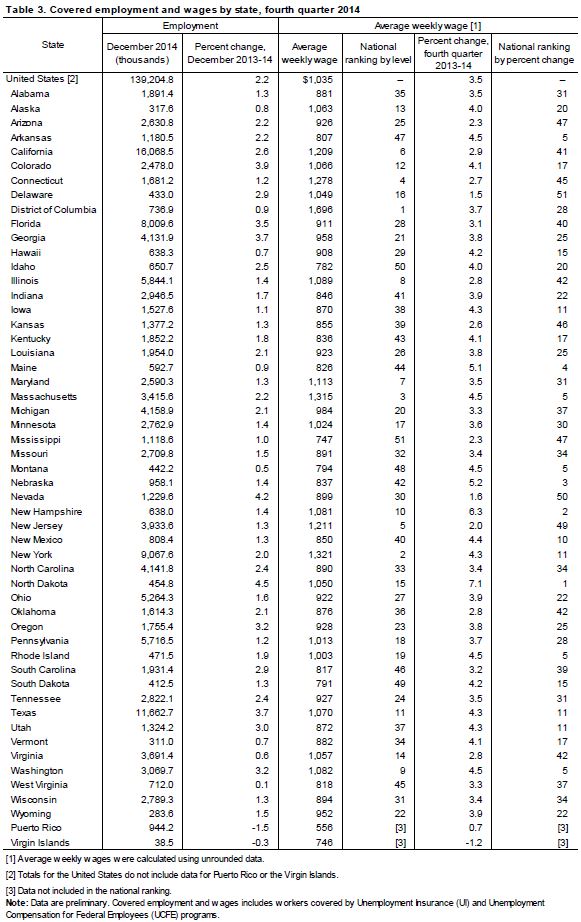
 Chittenden County’s 3.9-percent wage increase from the fourth quarter of 2013 to the fourth quarter of 2014 placed 125th across all large counties. Nationally, the average weekly wage increased 3.5 percent over the year to $1,035 in the fourth quarter of 2014. Nationwide, 332 of the 339 largest counties had over-the-year gains in average weekly wages from the fourth quarter of 2013. Benton, Ark., had the largest wage gain in the nation, up 9.9 percent.
Of the 339 largest counties, 7 experienced over-the year decreases in average weekly wages. San Mateo, Calif., had the largest average weekly wage decrease with a loss of 20.4 percent.
Large County Average Weekly Wages
The average weekly wage in Chittenden County placed in the top-third (99th) among the 339 largest U.S. counties in the fourth quarter of 2014. The county’s $1,032 average weekly wage was close to the U.S. average of $1,035. Among the highest-paid large U.S. counties, San Mateo, Calif., held the top position with an average weekly wage of $2,166. New York, N.Y., was second with an average weekly wage of $2,138, followed by Santa Clara, Calif. ($2,114), and Suffolk, Mass. ($1,856). Horry, S.C., reported the lowest wage nationwide ($610), followed by the Texas counties of Cameron ($621) and Hidalgo, Texas ($641). Wages in the lowest-ranked county, Horry, were less than one-third of the average weekly wage reported for the highest-ranked county, San Mateo, Calif.
Average Weekly Wages in Vermont’s Smaller Counties
The 13 counties in Vermont with employment below 75,000 had average weekly wages lower than the national average of $1,035. Among these smaller counties, Washington had the highest wage ($934) followed by Franklin ($844). Grand Isle reported the lowest weekly wage, averaging $662 in the fourth quarter of 2014. (See table 2.) When all 14 counties in Vermont are considered, 3 reported average weekly wages under $699, 4 had wages from $700 to $799, 5 had wages from $800 to $899, and 2 had wages of $900 or more. The lowest-paid counties, those with wages below $699, were generally located in the northern part of the state. (See chart 1.)
Additional Statistics and other Information
QCEW data for states have been included in this release in table 3. For additional information about quarterly employment and wages data, please read the Technical Note or visit the QCEW Web site at www.bls.gov/cew. An annual bulletin, Employment and Wages Annual Averages Online, features comprehensive information by detailed industry on establishments, employment, and wages for the nation and all states.
The 2013 edition of this publication, which was published in September 2014, contains selected data produced by Business Employment Dynamics (BED) on job gains and losses, as well as selected data from the first quarter 2014 version of the national news release. Tables and additional content from Employment and Wages Annual Averages 2013 are now available online at www.bls.gov/cew/cewbultn13.htm. The 2014 edition of Employment and Wages Annual Averages Online will be available in September 2015.
Information in this release will be made available to sensory impaired individuals upon request.
Source: BLS 8.4.2015. (Large counties are defined as those with employment of 75,000 or more as measured by 2013 annual average employment.)