by Anne Galloway vtdigger.org A revised revenue forecast for fiscal year 2016 puts the state back in the black. State economists say the general fund tax receipts will grow by 3 percent in the coming year, or by $40 million. At the beginning of 2015, revenues were down by $18 million.The revised forecast, presented Monday by Jeffrey Carr, the economist for the Shumlin administration, and Tom Kavet, the economist for the Vermont Legislature, shows modest growth in the state’s economy.
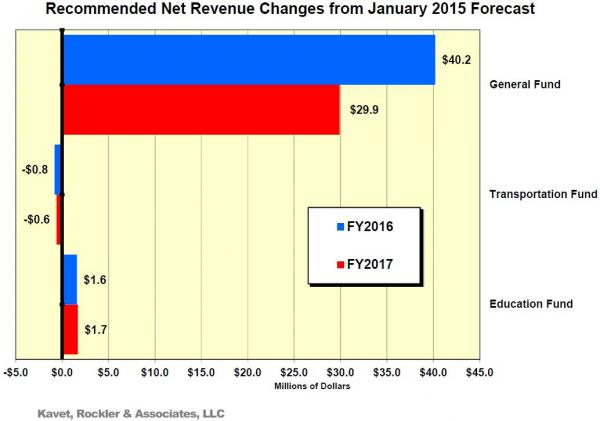
But most of the projected uptick in tax receipts, roughly $30 million, is the result of tax increases that were enacted this past year. The tax changes include an expansion of the sales tax to include soft drinks, the elimination of a tax deduction for state taxes paid in a prior year, a cap on tax deductions and a new meals tax on vending machine products. In addition, lawmakers found $53 million in spending reductions to help fill a $113 million budget gap.
Without the tax changes, general fund receipts would have grown by $9 million, according to Kavet.
General fund spending for fiscal year 2016 grew by 4.1 percent, or $59 million, to a total of $1.469 billion. Total spending grew by 1 percent and is projected to be $5.531 billion, including federal funds, transportation and education.
 Estimates for the mid-year budget adjustment (the true-up of spending and revenue) have not yet been calculated, but preliminary projections are in the $30 million range, according to information from the Joint Fiscal Office.
Medicaid costs have been higher than expected in recent months, and the trend is expected to continue well into next year.
Fiscal year 2015 ended with $25 million more in the state kitty than anticipated. The surplus will be used to subsidize the Low Income Home Energy Assistance Program ($5 million) and for unanticipated state Medicaid expenditures ($13 million). The remainder, roughly $7 million, will be divvied up for retired teachers’ health care (50 percent), the education fund (25 percent) and the rainy day reserve (25 percent).
Economy continues to grow, slowly
The economy is growing at the slowest rate since World War II, according to Kavet and Carr. While all of the indicators are pointing in a positive direction, nothing is happening fast. In the first quarter of 2015, for example, real estate prices inched up by 3 percent above the 2005 to 2009 peak price for property in the state. Corporate profits in Vermont reached a record $122 million in fiscal year 2015, and are now leveling off. Skier visits hit an all-time high of 4.7 million in fiscal year 2015.
Unemployment continues to shrink in Vermont. The state has the fourth lowest rate in the nation at 3.6 percent; the national average is 5.3 percent.
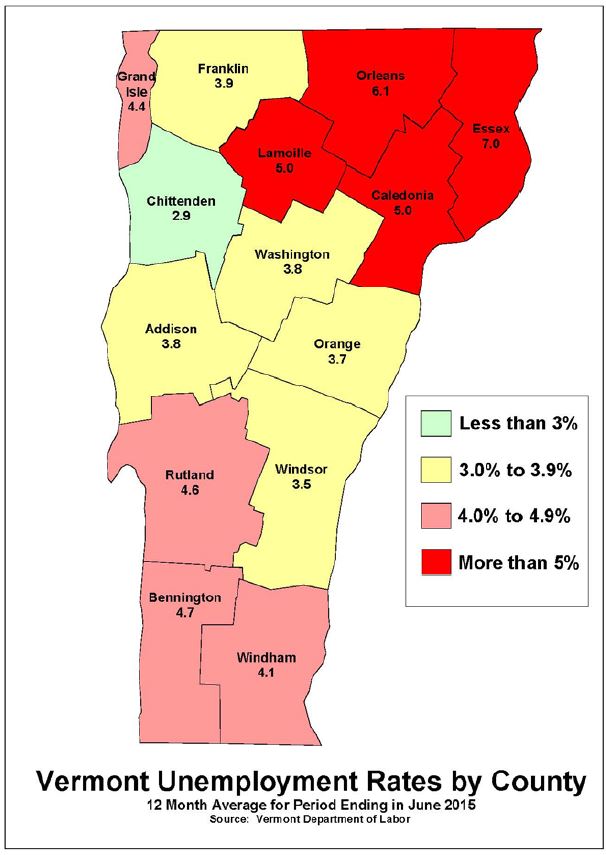
The Northeast Kingdom, which has traditionally had high jobless rates, continues to lag behind the rest of the state with unemployment in the 5 percent to 7 percent range, despite a temporary uptick in the workforce last year spurred by Jay Peak construction projects at two resorts.
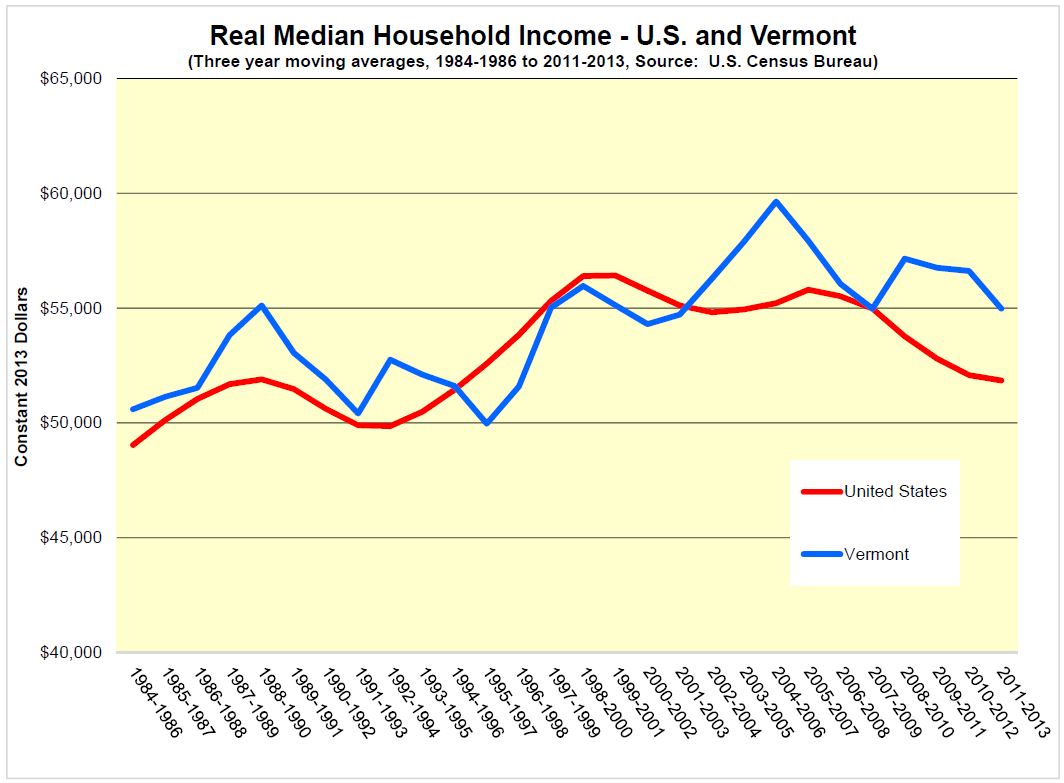
Wages have remained flat, and median household incomes have not recovered from the pre-recession high of nearly $60,000.
Total State revenues across all three major funds forecast herein closed fiscal year 2015 a mere 1.0% above prior January forecasts and 0.6% above yearago July projections. The slowest economic recovery in post-WW2 history will likely continue in FY16 and FY17, with some acceleration bringing slightly above-average revenue gains, though very close to previous expectations. Virtually all of the current changes in General Fund revenues relative to the prior January forecast, per the below chart, are the product of statutory changes made in the last legislative session, and represent about $30 million in new tax revenues. These tax changes primarily impact the General Fund, with the largest tax changes affecting personal income and sales taxes. Without these new tax revenues, the General Fund would have increased by about $9 million in FY16 and declined by about $1 million in FY17, relative to January projections.
Weak U.S. first quarter 2015 GDP growth, reported to have declined 0.2%, is likely to be another statistical aberration and is not a harbinger of an impending slowdown, as no major imbalances are evident in the economy at this time. On the contrary, the determinants for continued growth in investment and consumption in both the U.S. and Vermont - improving labor market conditions, emerging wage and income growth, accommodative financial conditions, relatively low fuel prices, and a strengthening real estate and housing market— remain intact. After 57 consecutive months of employment growth, the U.S. economy has added more than 12 million jobs and driven the unemployment rate to 5.3% in June, its lowest rate in more than 7 years. Continued employment gains of about 250,000 jobs per month - nearly double the rate of additions to the workforce - should leave the economy close to full employment within about a year, and finally support broader wage and income gains.
 Vermont employment growth has also strengthened in recent months, with year over year growth in the past 12 months accelerating to 1.4%, vs. 0.7% in the preceding 12 month period. This has pushed the State unemployment rate to 3.6%, the lowest in New England and the fourth lowest in the U.S. Per the chart on the preceding page, North Dakota has recently been replaced by Nebraska as the state with the lowest unemployment rate, as the precipitous decline in oil prices and related drilling activity begins to measurably impact energy-producing states. Until February of this year, North Dakota had boasted the lowest unemployment rate in the country for 74 consecutive months, largely avoiding the Great Recession.
- Unemployment rates among the 14 Vermont counties display with distressing persistence the economic divide between Chittenden County and the remainder of the State – as well as the perennially subaltern economic conditions in the Northeast Kingdom. Last year at this time, it appeared that job growth connected with EB-5 activity in Orleans County had offered some hope of a counter-trend in this region, but it has been short-lived. Employment in the county and region has continued to slip and some of the highest town unemployment rates are still found in this region.
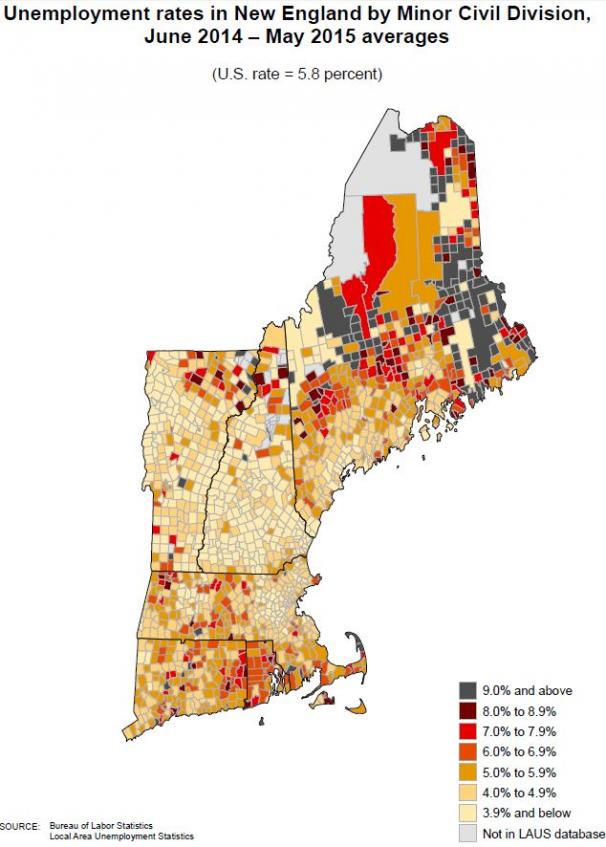
While towns in Chittenden County have some of the lowest unemployment rates, the economic benefits of the Burlington metropolitan area have gradually extended north, south and east of the State’s largest urban center, especially benefitting Franklin and Addison Counties. Aside from pockets of high unemployment in some Bennington County towns and notably, Killington in Rutland County, most of the economically distressed towns are in the Northeast Kingdom (as is the case in New Hampshire, as well).
- Since the last employment peak, sectoral growth in Vermont job markets has continued to favor business and professional service jobs, healthcare-related work, federal government jobs (many of which are border-related), tourism, and private educational services. Employment in manufacturing, construction, financial activities and trade/transportation/utilities are all still well-below prerecession levels. Of note, despite declines in durable manufacturing industries of 24%, nondurable manufacturing in the State has grown more than 9%.
Despite gradual improvement in labor markets, average workers have little to show for it in wage and income growth to date. Although there is evidence of wage acceleration for selected professions and skillsets, and exceptional income growth among corporations and owners of capital, overall real wages remain flat. The latest household income data, for example, show real median income in the three year period from 2011-2013 to be about the same as in the 1988-1990 period, more than 20 years ago, in both Vermont and the U.S.
Income growth has become increasingly concentrated among the highest income groups over the past 30 years and this has continued during the current economic recovery. Between 2009 and 2012, recent studies estimate that virtually all real US income growth accrued to the highest 1% of all income tax filers.2 These same analyses, however, suggest that in Vermont, income inequality has not been quite as pronounced, with income growth among the top 1% during this same period of 21.8% vs. growth among the bottom 99% of about 4.6%. They also suggest that longer term income inequality, though growing from lows in the late 1970’s to levels in 2012 not seen since the late 1920’s, are similarly less pronounced in Vermont than in the nation as a whole.
- Real estate and housing markets continue to heal in both Vermont and the nation. As illustrated in the chart on the preceding page, there are now 15 states where home prices have exceeded their pre-recession peaks and, for the fourth consecutive quarter, every state in the nation registered year-overyear price gains in the first quarter of 2015. Vermont’s increase (+2.7%), though one of the lowest among the 51 states, represented the strongest growth the State has experienced in the last 8 years. Rising prices are a precondition to recovery in the residential construction market and have already boosted housing sales in much of the country. The real estate markets with the strongest growth to date have been large urban areas that have attracted significant foreign investment and, until recently, energy producing states.
Despite headline news about the financial risks associated with the Greek debt calamity and slowing Chinese growth, the most serious downside forecast risk is probably the strengthening U.S. dollar. While this lowers import prices and inflation, it also make U.S. exports less competitive. Vermont is particularly sensitive to this as a relatively export-intensive state - with exports totaling about 13% of GDP (the highest in New England) vs. only 9% for the U.S.
Canada and China are now Vermont’s largest trading partners, together representing more than 60% of all State exports. The Canadian dollar, which traded at rough parity with the U.S. dollar from 2010 to 2013, is now 25% cheaper, causing Vermont exports to slow. Weakening Chinese demand has also played a role in declining Vermont exports. With the Greek debt crisis and associated political confusion battering the Euro and with few other stable global currencies available, the U.S. dollar may appreciate further, putting additional downward pressure on exports. In the past year alone, it is estimated that lower exports have cost the country about half a percentage point in GDP growth.
- Vermont agricultural exports have been particularly strong in recent years, growing from just under $50 million in 2000 to more than $230 million in 2013 (the latest year available). Over this period, Vermont had the highest growth rate in the nation (+13% per year, on a compound average annual basis). The increasing volatility in revenues due to a growing reliance on Personal Income, Corporate and Estate taxes,3 was on full display in both FY14 and FY15. In FY04, these three tax categories comprised 50.6% of Available General Fund tax revenues. In FY15, they represented 60.9% of revenues, and are expected to exceed 62% within the next five years.
State corporate income tax revenues were especially strong in FY15, reaching a record $122 million. As illustrated in the above chart, however, as the recovery ages, corporate profits typically slow. New hiring and investment all reduce taxable income and the declines can be steep. A record volume of carry-forwards could lead to much higher refunding in FY16 and recent corporate ownership changes also create downside State revenue risks.
Accordingly, corporate revenues are likely to retreat to a base of about $90 to $100 million in FY16 and FY17, with pronounced annual volatility – up or down – to be expected.
- Personal income tax revenues in FY15 ended the year about 0.6% above prior forecasts (+$4.1 million) and will add about $25 million in FY16 and beyond from tax law changes enacted during the recent legislative session that broaden taxable income, limit deductions and enhance compliance.
- Meals and rooms tax revenue in FY15 benefitted from the best winter tourism season ever, as stellar snow conditions and their opposite at many western resorts drove a record number of skiers to Vermont slopes. Although more “normal” conditions could slow growth in FY16, session changes adding vending machine sales to the meals tax should add about $1 million per year to this tax category.
After a near-record $35.5 million in FY14 receipts, estate tax revenue in FY15 withered to its lowest level in 19 years at just under $10 million. Rising potential tax liabilities caused by equity (especially) and real estate market gains, along with favorable demographic trends, suggest likely annual revenues in the $20- $30 million range over the next five years, however, year to year volatility could vary this by $15 million per year or more.
Bank Franchise tax receipts were $0.4 million below expectations in FY15, as tax expenditures applied as credits to this revenue source topped $1 million in the fourth quarter of FY15. Total FY15 credits deducted more than $3 million from reported Bank revenues and are expected to eliminate most, if not all, of the revenue growth that would otherwise occur in this tax category over the next five years.
- Sales and use tax revenues in FY15 finished the year extremely close to targets - about 0.3% below expectations. FY16 revenues will show above-average growth due primarily to statutory changes that will add about $8 million per year from an extension of the sales tax to soft drinks.
- Session changes to the Current Use program will ultimately benefit the Education Fund Property tax (not forecast herein), but will negatively impact FY16 “Other Tax” revenues in the General Fund by about $0.5M in FY16, as land use change tax revenues are foregone through the “easy out” provision.
 Total General Fund “Other” revenues (business licenses, fees, services, fines, etc.) will increase 9% in FY16, due to about $700,000 in new Fee revenues and a lucrative prison bed arbitrage that is expected to generate State Service revenues of approximately $1.7 million per year. This revenue is based on sales of Vermont prison beds by the Department of Corrections to the U.S. Marshal Service at a price exceeding our cost to house our own prisoners outof- state. By freeing up at least an additional 36 beds in FY16, these revenues and about $900,000 in net profit should be realized.
- Cigarette tax revenues exhibited surprising strength in FY15, closing the year $2.9 million above targets. Despite a 13 cent tax increase in FY15, the surge in receipts (especially concentrated in July of 2014 and June of 2015) suggests possible processing variances that may have shifted both prior and subsequent fiscal year revenues into FY15. As a result of this, FY16 revenues may not exhibit year-over-year growth typical of the 33 cent increase (from $2.75 per pack to $3.08) scheduled for this year. Revenue levels, however, will still exceed prior projections made during the session.
Five year revenue projections are included in Appendix A on pages 24 to 28. Although these are not required by statute, they have been requested by both the JFO and Administration for several years for longer term planning purposes. During the last legislative session, there was considerable misinformation and confusion regarding the role these longer term projections played in the recent (though not new) discussions of structural budget deficits. As a result of this, these tables will be published on a regular basis, so as to allow clarity with respect to longer term revenue potential and expectations. As illustrated in these tables, and consistent with past projections, longer term revenue growth from the mix and structure of the taxes in the three funds analyzed herein is unlikely to keep pace with recent levels of expenditure growth.
- The US and Vermont macro-economic forecasts upon which the revenue forecasts in this Update are based are summarized in Tables A and B on pages 17 and 18, and represent a consensus JFO and Administration forecast developed using internal JFO and Administration State economic models with input from Moody’s Analytics June and July 2015 projections and other major forecasting entities, including the Federal Reserve, EIA, CBO, IMF, Conference Board and private forecasting firms.
- Due to the reduced availability of forecasts from the New England Economic Partnership (NEEP), State consensus macroeconomic forecasts were developed using a new State on-line modeling capability provided by Moody’s Analytics. This forecasting capability allows timely, customized state forecasts with modeling capabilities similar to the prior NEEP capability.
- Forecast versus actual revenue variance data for the most recent nine years are illustrated in the chart on the following page. The below table summarizes the same data for the past fifteen years. As would be expected, January projections are generally more accurate than July – though in the most recent forecast, the July (2014) variance across all three funds was 0.6% above actual FY15 revenues while the January variance was slightly worse, at 1.0% above. Since fiscal year 2001, there have been 30 regular Consensus forecasts (January and July for each year) for each of the three major funds (General Fund, Transportation Fund and Education Fund) for a total of 90 observations. Over this fifteen year period, there have been 47 variances that were low (under-forecast actuals) and 43 variances that were high (over-forecast actuals). The average absolute value of the variance for these 15 years was just under 2% for total revenues across all three major funds.
Vermont Business Magazine contributed to this report.