Vermont Business Magazine While the new jobless rate numbers were driven mostly by significant decreases in the labor force and in the number of unemployed, there was also an increase in the number of people employed. The Vermont Department of Labor announced today that the seasonally-adjusted statewide unemployment rate for February was 3.9 percent. This represents a decrease of two-tenths of a percent from the revised January rate (4.1 percent). The national average in February was 5.5 percent, which experienced a decrease of two-tenths of a percent from the previous month’s estimate. Vermont’s unemployment rate was tied for 6th lowest in the country and lowest in the East (New Hampshire). Looking at historical data, February 2015 preliminary data is below 4.0 percent unemployment for the first time in Vermont since May 2007.
SEE Labor Market and Industry Tables Below
“February 2015 data marks the ninth consecutive month of reported (non-farm) employment levels above the 2007 pre-recessionary peak. Vermont’s unemployment rate – at 3.9 percent – is back as low as those reported before the recession. These are both signs of better economic conditions in certain regions of the state. The Department is working with our schools and our workforce training providers to increase training and work-based learning opportunities to help Vermonters find good jobs. Stop by a Vermont Department of Labor regional office, or visit our website to find out about our services which are free and available to all Vermonters”, said Labor Commissioner Annie Noonan.
 “This is positive news for Vermont’s economy,” said Governor Peter Shumlin. “Combined with the revised jobs numbers released last month, which showed an increase of 3,400 jobs in 2014, Vermont’s economy continues its recovery and is moving in the right direction. We still have a lot of work to do to ensure Vermont’s economy works for every single Vermonter. That is why we are focused on tackling rising health care and property tax costs, two of the biggest lags on wage growth for middle class Vermonters.”
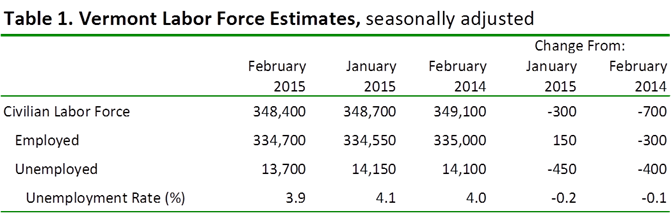
The seasonally adjusted Vermont data for February show the Vermont civilian labor force decreased by 300 from the prior month estimates. The number of employed increased by 150 and the number of unemployed decreased by 450. The over-the-month changes to the number of unemployed and the unemployment rate were statistically significant in the seasonally-adjusted series.
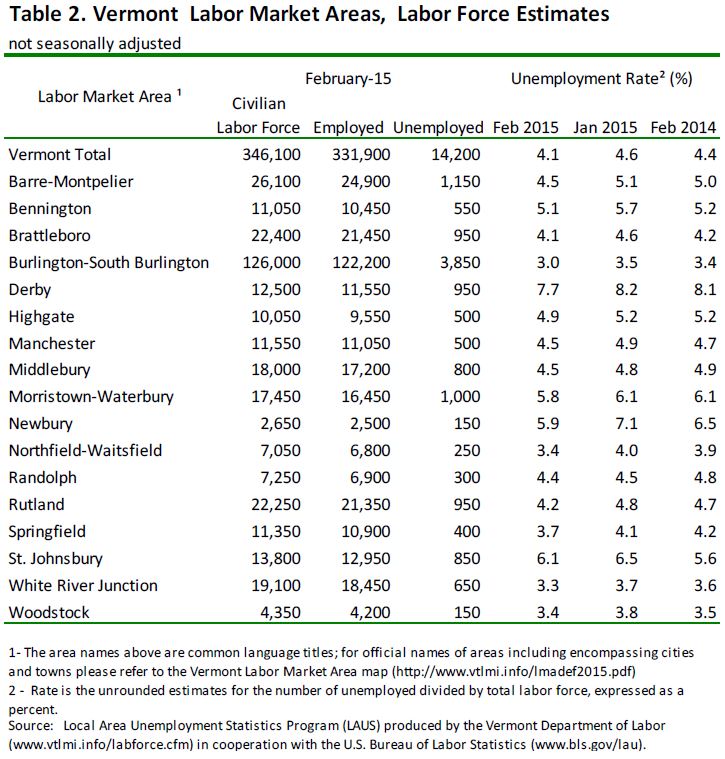
February unemployment rates for Vermont’s 17 labor market areas ranged from 3.0 in Burlington-South Burlington to 7.7 in Derby (note: local labor market area unemployment rates are not seasonally adjusted). For comparison, the February unadjusted unemployment rate for Vermont was 4.1 percent which reflects a decrease of five-tenths of a percent from the revised January level and a decrease of three-tenths of a percent from a year ago.
 US Unemployment Rate Last 10 Years
Not Seasonally Adjusted
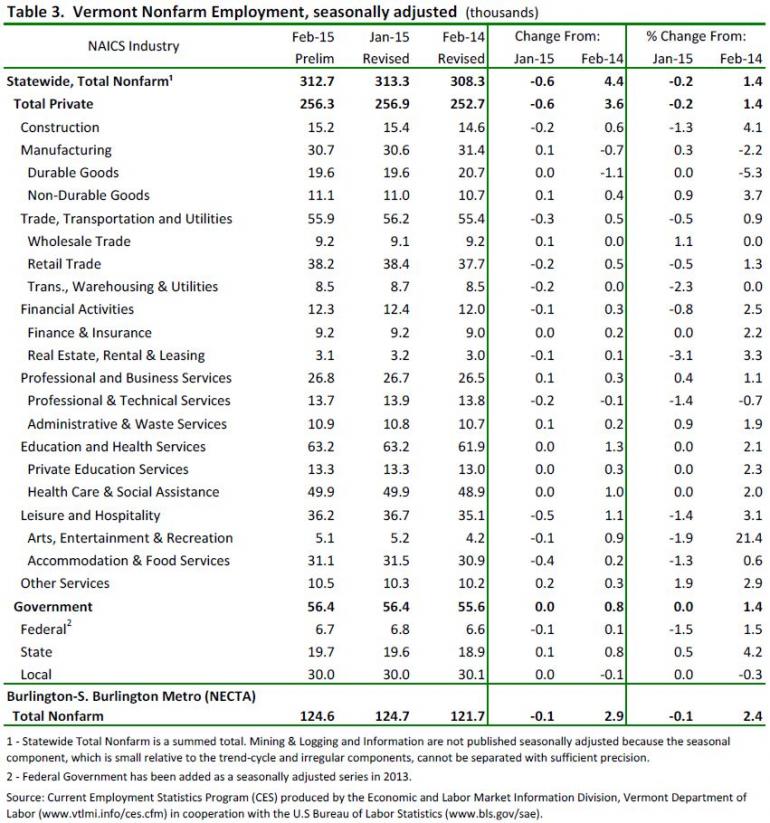
The preliminary ‘not-seasonally-adjusted’ jobs estimates for February show an increase of 1,500 jobs when compared to the revised January numbers. There was an increase of 400 jobs between the preliminary and the revised January estimates due to the inclusion of more data. The monthly increase seen in the February numbers was attributable to seasonal increases related to private and public education. The broader economic trends can be detected by focusing on the over-the-year changes in this data series. As detailed in the preliminary ‘not-seasonally-adjusted’ February data, Total Private industries have increased by 4,500 jobs (1.8 percent) and Government employment increased by 900 jobs (1.6 percent) in the past year.
Seasonally Adjusted
The seasonally adjusted data for February reports a decrease of 600 jobs from the revised January data. As with the ‘not-seasonally-adjusted’ data, this over-the-month change is from the revised January numbers which experienced a 500 job increase from the preliminary estimates. The seasonally adjusted over-the-month changes in February were minor at the sectorial level. Those with a notable percent increase include: Other Services (+200 jobs or +1.9%), Professional and Business Services (+100 jobs or +0.4%) and Manufacturing (+100 jobs or +0.3%). Industries with a notable percent decrease include: Leisure and Hospitality (-500 jobs or -1.4%) and Construction (-200 jobs or -1.3%).
| Current Unemployment Rates for States and Historical Highs/Lows Seasonally Adjusted |
|||||
|---|---|---|---|---|---|
| Feb. 2015p | Historical High | Historical Low | |||
| State | Rate | Date | Rate | Date | Rate |
| Alabama | 5.8 | Dec. 1982 | 15.5 | Apr. 2007 | 3.8 |
| Alaska | 6.3 | Aug. 1986 | 11.2 | Feb. 2015 | 6.3 |
| Arizona | 6.5 | Dec. 1982 | 11.5 | July 2007 | 3.7 |
| Arkansas | 5.5 | Feb. 1983 | 10.3 | Sept. 2000 | 4.2 |
| California | 6.7 | Oct. 2010 | 12.2 | Dec. 2000 | 4.7 |
| Colorado | 4.2 | Oct. 2010 | 8.9 | Dec. 2000 | 2.7 |
| Connecticut | 6.4 | Jan. 1976 | 10.0 | Oct. 2000 | 2.2 |
| Delaware | 4.8 | Dec. 1976 | 9.8 | June 1988 | 3.0 |
| District of Columbia | 7.8 | Sept. 1983 | 11.3 | Sept. 1989 | 4.8 |
| Florida | 5.6 | Jan. 2010 | 11.2 | Apr. 2006 | 3.1 |
| Georgia | 6.3 | Dec. 2010 | 10.5 | Nov. 2000 | 3.4 |
| Hawaii | 4.1 | Jan. 1976 | 10.4 | Dec. 2006 | 2.4 |
| Idaho | 3.9 | Dec. 1982 | 10.2 | June 2007 | 2.9 |
| Illinois | 6.0 | Feb. 1983 | 13.1 | Feb. 1999 | 4.1 |
| Indiana | 5.9 | Dec. 1982 | 12.6 | Oct. 2000 | 2.9 |
| Iowa | 4.1 | Jan. 1983 | 9.1 | Mar. 2000 | 2.4 |
| Kansas | 4.2 | Sept. 2009 | 7.3 | Aug. 1978 | 2.9 |
| Kentucky | 5.2 | Feb. 1983 | 12.1 | May 2000 | 4.0 |
| Louisiana | 6.7 | Nov. 1986 | 13.1 | Oct. 2007 | 3.9 |
| Maine | 5.0 | Jan. 1977 | 9.0 | Dec. 2000 | 3.2 |
| Maryland | 5.5 | Mar. 1982 | 8.5 | Dec. 1999 | 3.3 |
| Massachusetts | 4.9 | Jan. 1976 | 10.7 | Oct. 2000 | 2.6 |
| Michigan | 5.9 | Dec. 1982 | 16.5 | Mar. 2000 | 3.2 |
| Minnesota | 3.7 | Jan. 1983 | 8.9 | Mar. 1999 | 2.5 |
| Mississippi | 7.0 | Apr. 1983 | 12.8 | Jan. 2001 | 5.0 |
| Missouri | 5.5 | Apr. 1983 | 10.6 | Jan. 2000 | 3.1 |
| Montana | 4.3 | May 1983 | 8.8 | Feb. 2007 | 2.9 |
| Nebraska | 2.7 | Feb. 1983 | 6.3 | Oct. 1990 | 2.3 |
| Nevada | 7.1 | Nov. 2010 | 13.7 | Jan. 1999 | 3.7 |
| New Hampshire | 3.9 | July 1992 | 7.4 | Mar. 1988 | 2.2 |
| New Jersey | 6.4 | Jan. 1977 | 10.7 | May 2000 | 3.5 |
| New Mexico | 6.0 | Mar. 1983 | 10.5 | Aug. 2007 | 3.7 |
| New York | 5.8 | Jan. 1976 | 10.4 | May 1988 | 4.0 |
| North Carolina | 5.3 | Mar. 2010 | 11.3 | Apr. 1999 | 3.0 |
| North Dakota | 2.9 | Mar. 1983 | 6.2 | Jan. 1998 | 2.5 |
| Ohio | 5.1 | Jan. 1983 | 14.0 | Apr. 2001 | 3.8 |
| Oklahoma | 3.9 | Apr. 1983 | 8.9 | Dec. 2000 | 2.9 |
| Oregon | 5.8 | May 2009 | 11.9 | Feb. 1995 | 4.7 |
| Pennsylvania | 5.2 | Feb. 1983 | 12.7 | May 2000 | 4.0 |
| Rhode Island | 6.3 | Aug. 2009 | 11.3 | May 1988 | 2.9 |
| South Carolina | 6.6 | Jan. 1983 | 11.8 | Apr. 1998 | 3.5 |
| South Dakota | 3.4 | Jan. 1983 | 5.9 | July 2000 | 2.4 |
| Tennessee | 6.6 | Jan. 1983 | 12.9 | Mar. 2000 | 3.7 |
| Texas | 4.3 | Nov. 1986 | 9.2 | Dec. 2000 | 4.0 |
| Utah | 3.4 | Mar. 1983 | 9.6 | Mar. 2007 | 2.3 |
| Vermont | 3.9 | Feb. 1976 | 8.8 | Mar. 2000 | 2.6 |
| Virginia | 4.7 | Dec. 1982 | 7.9 | Nov. 2000 | 2.1 |
| Washington | 6.3 | Nov. 1982 | 12.2 | June 2007 | 4.6 |
| West Virginia | 6.1 | Feb. 1983 | 18.8 | Aug. 2008 | 4.1 |
| Wisconsin | 4.8 | Jan. 1983 | 11.9 | July 1999 | 3.0 |
| Wyoming | 4.0 | Dec. 1986 | 9.4 | May 1979 | 2.5 |
p = preliminary.
NOTE: Rates shown are a percentage of the labor force. Data refer to place of residence. Series begin in January 1976. Historical highs and lows show the most recent month that a rate was recorded in the event of multiple occurrences. Estimates for at least the latest five years are subject to revision early in the following calendar year.
 Source: VT Labor Dept. 3.27.2015