Vermont Business Magazine Bad mortgages in Vermont followed a downward trend as total non-current home loans across the country continue to plummet. There was a slight increase nationally in foreclosure starts from November, according to a national rating firm. Vermont's non-current mortgages were 6.9 percent in December 2014 (compared to 7.4 percent in November 2014), down 21.6 percent from a year ago. Foreclosures in Vermont were 4.9 percent and non-delinquencies were 2 percent (in November they were 5.3 percent and 2.1 percent of all mortgages).
The US average was 7.3 percent (7.7 percent in November), down 13.8 percent from a year ago. Vermont is in the middle of the pack in non-current loans, after first being well behind at the start of the Great Recession and then seeing bad mortgages steadily increase. The state has recently started to reduce the number of such loans at a faster rate than the national average.
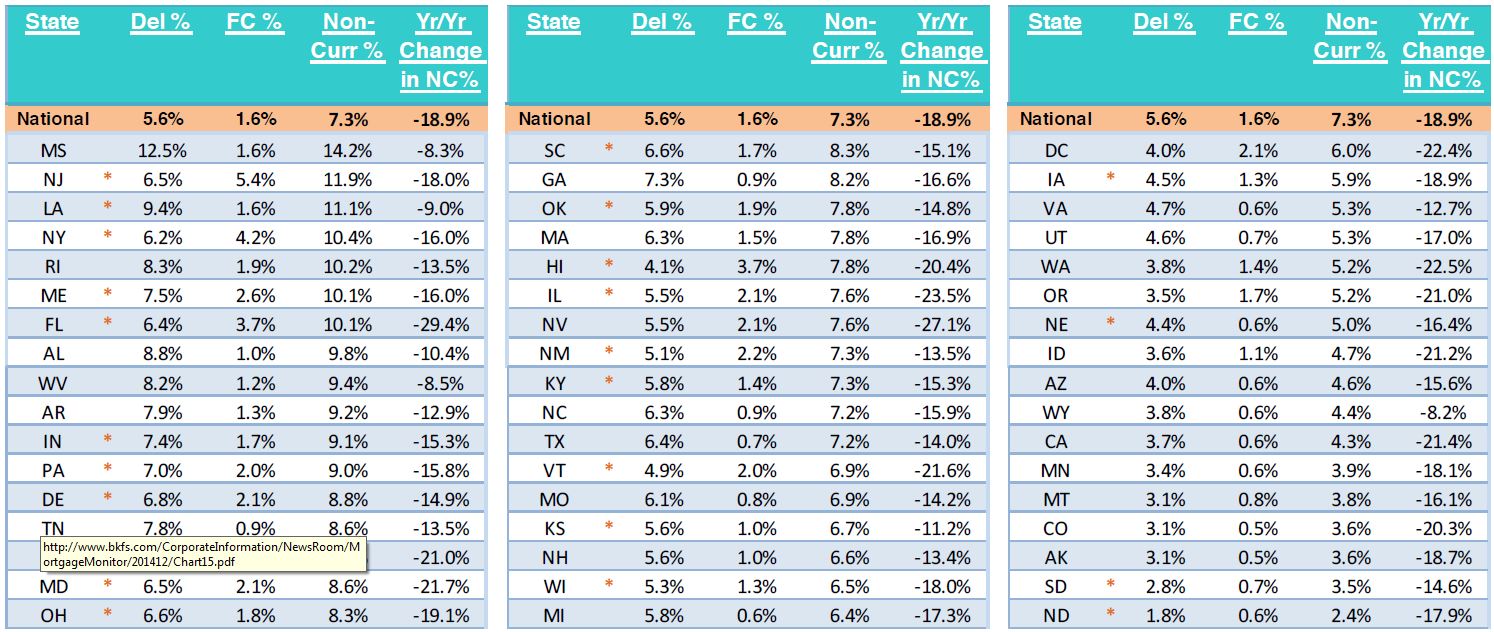
The Data and Analytics division of Black Knight Financial Services reported the December 2014 month-end mortgage performance statistics, which are derived from its loan-level database represent approximately two-thirds of the overall market.
- Total US loan delinquency rate (loans 30 or more days past due, but not in foreclosure): 5.64%, Month-over-month change: -7.21%, Year-over-year change: -12.72%
- Total U.S. foreclosure pre-sale inventory rate: 1.61%, Month-over-month change: -1.10%, Year-over-year change: -34.94%
- Total U.S. foreclosure starts: 89,400, Month-over-month change: 20.97%, Year-over-year change: -14.69%
Monthly Prepayment Rate: 1.15%
Month-over-month change: 25.36%
Year-over-year change: 28.43%
Foreclosure Sales as % of 90+: 1.57%
Month-over-month change: 5.29%
Year-over-year change: -14.19%
Number of properties that are 30 or more days past due, but not in foreclosure: 2,868,000
Month-over-month change: -220,000
Year-over-year change: -375,000
Number of properties that are 90 or more days past due, but not in foreclosure: 1,132,000
Month-over-month change: -31,000
Year-over-year change: -148,000
Number of properties in foreclosure pre-sale inventory: 820,000
Month-over-month change: -9,000
Year-over-year change: -424,000
Number of properties that are 30 or more days past due or in foreclosure: 3,688,000
Month-over-month change: -229,000
Year-over-year change: -800,000
Top 5 States by Non-Current* Percentage
Mississippi: 14.18%
New Jersey: 11.90%
Louisiana: 11.06%
New York: 10.39%
Rhode Island: 10.16%
Bottom 5 States by Non-Current* Percentage
Montana: 3.83%
Colorado: 3.58%
Alaska: 3.56%
South Dakota: 3.54%
North Dakota: 2.38%
Top 5 States by 90+ Days Delinquent Percentage
Mississippi: 5.30%
Rhode Island: 3.85%
Louisiana: 3.61%
Alabama: 3.56%
Maine: 3.42%
Top 5 States by 6-Month Improvement in Non-Current* Percentage
Alaska: -14.82%
Oregon: -9.77%
District of Columbia: -9.76%
Florida: -9.74%
Washington: -9.29%
Top 5 States by 6-Month Deterioration in Non-Current* Percentage
Kansas: 3.05%
Wyoming: 2.58%
Louisiana: 1.82%
Arizona: 1.68%
Arkansas: 1.52%
*Non-current totals combine foreclosures and delinquencies as a percent of active loans in that state.
Notes:
- Totals are extrapolated based on Black Knight Financial Services' loan-level database of mortgage assets.
- All whole numbers are rounded to the nearest thousand, except foreclosure starts, which are rounded to the nearest hundred.
Source:Black Knight Financial Services, LLC. Black Knight Financial, a Fidelity National Financial (NYSE:FNF) company, is the mortgage and finance industries’ leading provider of integrated technology, data and analytics solutions that facilitate and automate many of the business processes across the mortgage lifecycle.