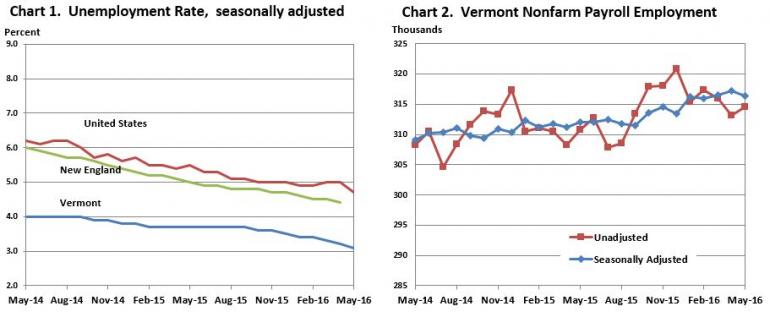
Vermont Business Magazine Employment was up, unemployment was down and the labor force even increased for the second month in a row. The Vermont Department of Labor announced today that the seasonally-adjusted statewide unemployment rate for May was 3.1 percent. This represents a decrease of one-tenth of one percentage point from the revised April rate (3.2 percent). Overall, Vermont’s unemployment rate is fourth lowest in the country, behind South Dakota (2.5 percent), New Hampshire (2.7 percent), and Nebraska (3.0 percent). The national rate in May was 4.7 percent. As of the prior month’s initial data, the Burlington-South Burlington Metropolitan NECTA had the second lowest unemployment rate in the country for all metropolitan areas at 2.1 percent (not-seasonally-adjusted). May is the 10th consecutive month reporting a decline to the number of unemployed persons in Vermont (seasonally-adjusted).
| Unemployment Rates for States Monthly Rankings Seasonally Adjusted May 2016p |
||
|---|---|---|
| Rank | State | Rate |
| 1 | SOUTH DAKOTA | 2.5 |
| 2 | NEW HAMPSHIRE | 2.7 |
| 3 | NEBRASKA | 3.0 |
| 4 | VERMONT | 3.1 |
| 5 | HAWAII | 3.2 |
| 5 | NORTH DAKOTA | 3.2 |
| 7 | COLORADO | 3.4 |
| 8 | MAINE | 3.5 |
| 9 | IDAHO | 3.7 |
| 9 | KANSAS | 3.7 |
| 11 | ARKANSAS | 3.8 |
| 11 | MINNESOTA | 3.8 |
| 11 | UTAH | 3.8 |
| 11 | VIRGINIA | 3.8 |
| 15 | IOWA | 3.9 |
| 16 | DELAWARE | 4.1 |
| 16 | TENNESSEE | 4.1 |
| 18 | MASSACHUSETTS | 4.2 |
| 18 | MONTANA | 4.2 |
| 18 | WISCONSIN | 4.2 |
| 21 | MISSOURI | 4.3 |
| 22 | TEXAS | 4.4 |
| 23 | MARYLAND | 4.5 |
| 23 | OREGON | 4.5 |
| 25 | FLORIDA | 4.7 |
| 25 | MICHIGAN | 4.7 |
| 25 | NEW YORK | 4.7 |
| 25 | OKLAHOMA | 4.7 |
| 29 | NEW JERSEY | 4.9 |
| 30 | INDIANA | 5.0 |
| 31 | KENTUCKY | 5.1 |
| 31 | NORTH CAROLINA | 5.1 |
| 31 | OHIO | 5.1 |
| 34 | CALIFORNIA | 5.2 |
| 35 | GEORGIA | 5.3 |
| 36 | RHODE ISLAND | 5.4 |
| 37 | PENNSYLVANIA | 5.5 |
| 38 | ARIZONA | 5.6 |
| 38 | SOUTH CAROLINA | 5.6 |
| 38 | WYOMING | 5.6 |
| 41 | CONNECTICUT | 5.7 |
| 42 | MISSISSIPPI | 5.8 |
| 42 | WASHINGTON | 5.8 |
| 44 | ALABAMA | 6.1 |
| 44 | DISTRICT OF COLUMBIA | 6.1 |
| 44 | NEVADA | 6.1 |
| 47 | NEW MEXICO | 6.2 |
| 47 | WEST VIRGINIA | 6.2 |
| 49 | LOUISIANA | 6.3 |
| 50 | ILLINOIS | 6.4 |
| 51 | ALASKA | 6.7 |
However, the number of construction jobs fell by about 1,000 from April and tourism-related employment fell slightly, which are both unsual occurrences for this time of year. Overall jobs fell by an estimated 800 positions. (Because people might work more than one job, the number of employed and number of jobs is not the same. See notes below.)
In the last year, the Vermont economy has seen employment growth across many sectors. Construction, non-durable manufacturing, professional and business services, health and social services and leisure and hospitality industries have led the way.
The Vermont Department of Labor is partnering with employers, training providers, and educational institutions to make sure the Vermont workforce is able to access current and future openings. In addition, significant work is underway educating young Vermonters about the career opportunities in this state. Connecting Vermont’s young people with these opportunities will be the focus of the June 23rd event at the King Street Youth Center in Burlington. Contact your local Vermont Department of Labor office to learn more”, said Labor Commissioner Annie Noonan.
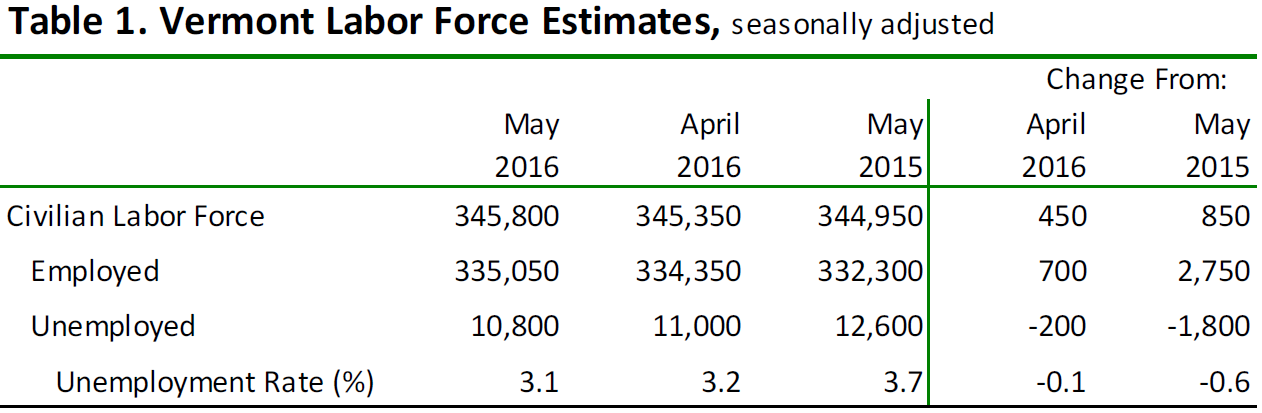
The Vermont seasonally-adjusted unemployment rate declined by one-tenth of one percentage point in May to a statewide average of 3.1 percent. The United States rate is 4.7 percent, a decrease of three tenths of one percentage point compared to the revised April estimate. The seasonally-adjusted Vermont data for May show the Vermont civilian labor force increased by 450 from the prior month’s revised estimate. The number of employed increased by 700 and the number of unemployed decreased by 200. None of the over-the-month changes were statistically significant in the seasonally-adjusted series.
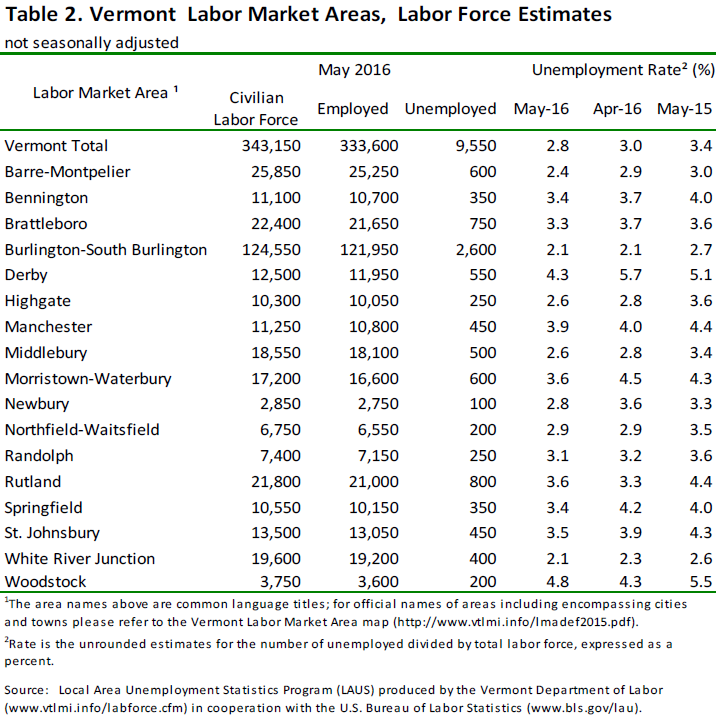
The May unemployment rates for Vermont’s 17 labor market areas ranged from 2.1 percent in Burlington-South Burlington and White River Junction to 4.8 percent in Woodstock (note: local labor market area unemployment rates are not seasonally-adjusted). For comparison, the May unadjusted unemployment rate for Vermont was 2.8 percent which reflects a decrease of two-tenths of one percentage point from the revised unadjusted April level and a decrease of six-tenths of one percentage point from a year ago.
Not-Seasonally-Adjusted
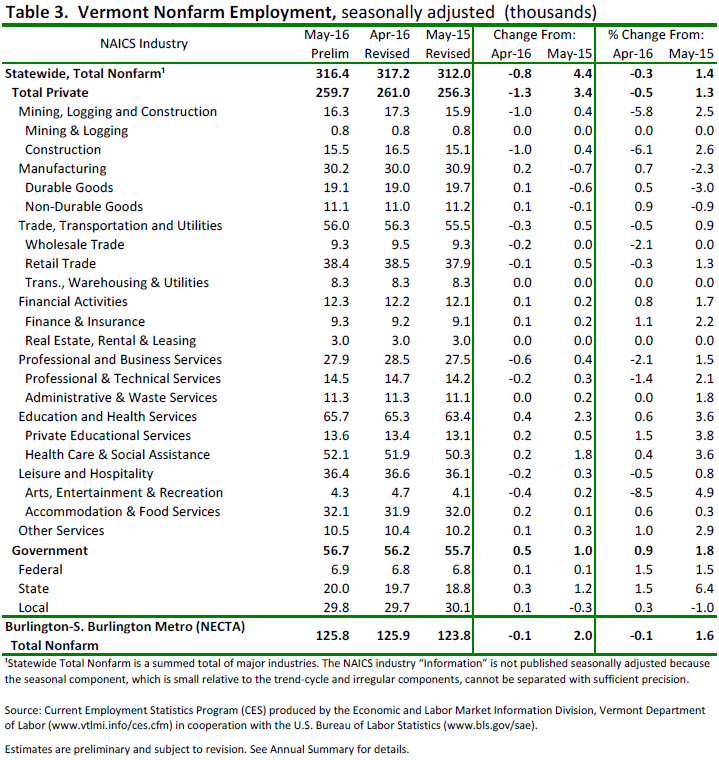
The preliminary ‘not-seasonally-adjusted’ jobs estimates for May show an increase of 1,400 jobs when compared to the revised April numbers. There was no change between the preliminary and the revised April estimates due to the inclusion of more data. The monthly increase seen in the May numbers was primarily attributable to the Construction sector. The broader economic trends can be detected by focusing on the over-the-year changes in this data series. As detailed in the preliminary ‘not-seasonally-adjusted’ May data, Total Private industries have increased by 2,800 jobs (1.1 percent) and Government (including public education) employment has increased by 900 jobs (1.6 percent) in the past year.
Seasonally-Adjusted
The seasonally-adjusted data for May reports a decrease of 800 jobs from the revised April data. As with the ‘not-seasonally-adjusted’ data, this over-the-month change is from the revised April numbers which also experienced no change from the preliminary estimates. The seasonally-adjusted over-the-month changes in May were mixed at the sectorial level. Those with a notable percent increase include: Private Educational Services (+200 jobs or +1.5%) and Manufacturing (+200 jobs or +0.7%). Industries with a notable percent decrease include: Arts, Entertainment & Recreation (-400 jobs or -8.5%), Construction (-1,000 jobs or -6.1%), and Wholesale Trade (-200 jobs or -2.1%).
NOTE: Employment (nonfarm payroll) - A count of all persons who worked full- or part-time or received pay from a nonagricultural employer for any part of the pay period which included the 12th of the month. Because this count comes from a survey of employers, persons who work for two different companies would be counted twice. Therefore, nonfarm payroll employment is really a count of the number of jobs, rather than the number of persons employed. Persons may receive pay from a job if they are temporarily absent due to illness, bad weather, vacation, or labor-management dispute. This count is based on where the jobs are located, regardless of where the workers reside, and is therefore sometimes referred to as employment "by place of work." Nonfarm payroll employment data are collected and compiled based on the Current Employment Statistics (CES) survey, conducted by the Vermont Department of Labor. This count was formerly referred to as nonagricultural wage and salary employment.
p = preliminary.
NOTE: Rates shown are a percentage of the labor force. Data refer to place of residence. Estimates for the current month are subject to revision the following month.“