Vermont Business Magazine Wholesale power markets in New England operated competitively last year, bringing lower average power prices that reflected the drop in the price of natural gas in 2015, according to the 2015 Annual Markets Report issued yesterday by the Internal Market Monitor (IMM) of ISO New England Inc. ISO is the operator of the region’s bulk power system and wholesale electricity markets. Natural gas in recent years has also increased its market share in generation. The average real-time price of wholesale electric energy in 2015 fell by more than a third, or more than $22 per megawatt-hour (MWh), to $41.00/MWh as a result of natural gas prices that were 41% lower than their 2014 average. Vermont prices were in the middle range at $41.58, with Maine lowest and the Boston area highest. The prices of both natural gas and wholesale power were the lowest since 2012. The price of natural gas is a key factor in the price of wholesale power because the fuel generates 49% of the electricity produced in New England. The cost of fuel is the largest input into the cost of electricity production.
“Natural gas prices fell last year with increased domestic production, above-average storage levels nationally, and mild weather that moderated demand for natural gas for heating and power generation for most of the year. Because of the moderate demand, there was sufficient space in the region’s natural gas pipeline infrastructure to deliver low-priced natural gas to the region’s generators. The New England markets were competitive in 2015, as demonstrated by the close linkage between natural gas and wholesale power prices,” said Jeffrey McDonald, ISO New England’s vice president of market monitoring. McDonald noted that this year’s report includes several new features, including an enhanced methodology to account for energy market costs, new metrics to measure market competitiveness, and many new tables and charts.
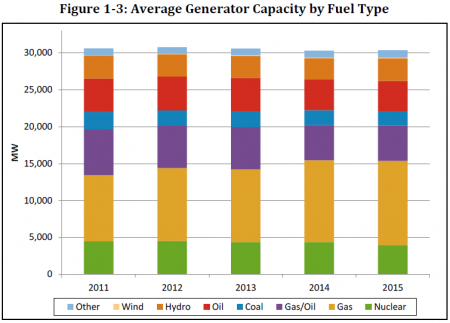 The capacity mix is characterized by an aging and declining fleet of oil- and coal-fired generators, many of which were constructed during the 1960s and 1970s. Also, with the retirement of the Vermont Yankee nuclear station, older generators are increasingly being displaced by new technologies. Most new investments have been in new natural gas generators rather than in new or upgrades in coal or oil generators. In parallel, there has also been new investment in renewable generation such as wind and solar.
Key findings of the 2015 Annual Markets Report:
· Wholesale electricity market value: The total value of the region’s wholesale electricity markets, including electric energy, capacity, and ancillary services markets, as well as the cost of transmission, fell about 25%, from about $12.4 billion in 2014 to about $9.3 billion in 2015.
o In the 2015 Annual Markets Report, the cost of the region’s high-voltage transmission network is included in the total wholesale market value for the first time. Excluding the $2 billion transmission cost, the total value of New England’s wholesale markets in 2015 was $7.3 billion, down from $10.6 billion in 2014.
· Wholesale electric energy prices: The average real-time price for wholesale electric energy fell by 35%, or more than $22/MWh, from $63.32/MWh in 2014 to $41/MWh in 2015. Electric energy comprised $5.9 billion of the total market value in 2015, down 35% from the 2014 energy market value of $9.1 billion.
· Fuel costs: The average price of natural gas fell 41% last year, from $7.99 per million British thermal units (MMBtu) in 2014 to $4.73/MMBtu in 2015.
o During January, February, and March of 2015, natural gas averaged $11.36/MMBtu, consistent with price spikes that occurred in previous winters when the total regional gas demand stressed the region’s natural gas infrastructure. However, the 2015 first-quarter price was 43% lower than the 2014 first-quarter average of $20.04/MMBtu.
o Natural-gas-fired power plants set the real-time price for power 75% of the time in 2015, up from 70% in 2014.
· Consumption: At 126,833 gigawatt-hours (GWh), total electricity usage in New England was 0.3% lower in 2015 than in 2014, when 127,175 GWh was consumed.
· Reliability commitments: Resources can receive payments, in addition to energy market revenues, to cover their costs if they are needed to help ensure the reliability of New England’s bulk power system. These additional payments fell by 32% to about $119 million in 2015, consistent with lower natural gas prices.
· Ancillary services: Ancillary services ensure the reliable operation of the regional power system. Additional resources are maintained in reserve at all times so the system can recover from the unexpected loss of a resource. Some resources can provide regulation, or the ability to alter their output on a minute-to-minute basis to balance supply and demand and maintain system frequency. The cost of ancillary services fell by 39% to about $144 million as a consequence of lower fuel costs.
· Capacity: The cost of capacity in 2015 rose by 5% to $1.1 billion. The report notes that natural-gas-fired generation represents about 78% of the new capacity clearing in the past eight auctions.
· Demand resources: Participation in the capacity market by demand-side resources, which include both energy-efficiency measures and active demand-response resources, increased 15%, or 274 MW, to total 2,095 MW in December 2015. Payments to demand resources providing capacity totaled $85.2 million in 2015, down 5.7% from the $90.3 million paid in 2014.
The ISO relies on two independent market monitors, one internal and one external. The market monitors annually review and report on market results and offer insights into the markets’ efficiency and competitiveness, as well as the markets’ design and needed operational enhancements.
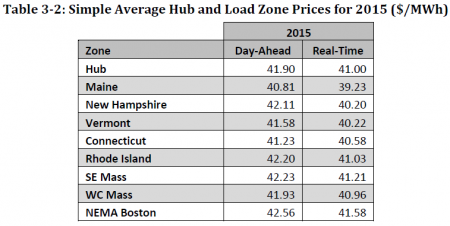 The average absolute difference between the Hub annual average price and average load zone prices was $0.45/MWh in the day-ahead energy market and $0.58/MWh in the real-time energy market – a difference of approximately 1.0-1.5%. The Maine load zone had the lowest average prices in the region, while the NEMA-Boston load zone had the highest. This occurred in both the day-ahead and real-time energy markets. Maine’s prices averaged $1.09/MWh and $1.77/MWh lower than the Hub’s prices during the year for the day-ahead and real-time energy markets, respectively. NEMA-Boston’s average prices were slightly higher than the Hub’s prices, by $0.66/MWh and $0.59/MWh, respectively.
The IMM reports directly to ISO New England’s Board of Directors, giving the market monitoring unit the independence needed to objectively perform its functions. The IMM submits the annual report simultaneously to the ISO and the Federal Energy Regulatory Commission, which is charged with ensuring that markets within its jurisdiction are free of design flaws and inappropriate market behavior.
Holyoke, MA—May 26, 2016—ISO