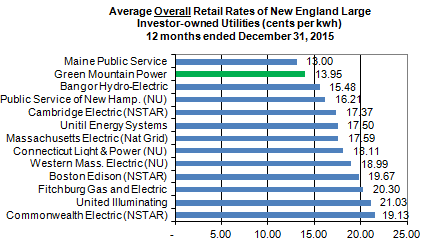
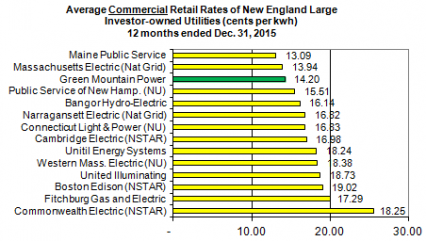
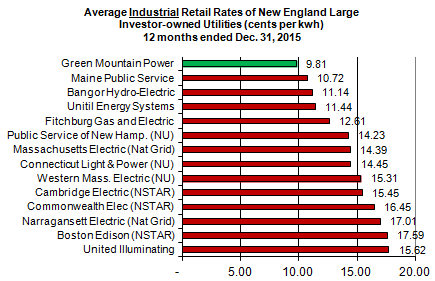
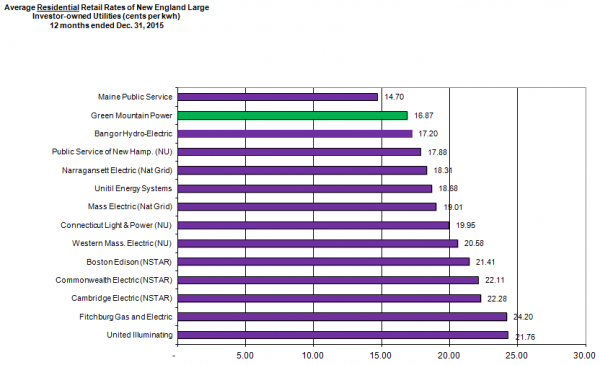
Vermont Business Magazine Green Mountain Power rates continue to rank among the lowest of New England’s largest utilities, according to the most recent data compiled by the Edison Electric Institute. Overall, GMP’s rates are the second lowest and 17 percent lower than the regional average, while its industrial rates are the lowest. Residential customer rates are ranked second lowest and commercial rates third lowest of the 14 utilities ranked, which cover the bulk of customers in New England. For March 2016 rates, Vermont had the lowest residential rates (17.11 cents per kwh) and second lowest overall (14.33) to Maine (13.01). The overall US average in March was 10.01 cents per kwh.
 “It is so important that we keep costs low and stable for customers and that we remain competitive in our region, while also leading the nation with investments in new innovations and a clean energy future,” said Mary Powell, President and Chief Executive Officer of Green Mountain Power. “Clean, reliable and cost-effective energy is essential for the families and businesses of our state.
“It is so critical for a municipal water supplier like Champlain Water District to have stable electric rates and it is very encouraging to see that GMP’s rates are competitive across our region,” said Jim Fay, General Manager of Champlain Water District. “When GMP keeps rates low it helps us in our continued mission of supplying drinking water to our 12 served municipal systems within Chittenden County at a predictable low cost.”
| Source: Edison Electric Institute, FERC Form I | |
| 2015 | |
| Overall | |
| Total | |
| Commonwealth Electric (NSTAR) | 21.50 |
| United Illuminating | 21.03 |
| Fitchburg Gas and Electric | 20.30 |
| Boston Edison (NSTAR) | 19.67 |
| Western Mass. Electric (NU) | 18.99 |
| Connecticut Light & Power (NU) | 18.11 |
| Massachusetts Electric (Nat Grid) | 17.59 |
| Unitil Energy Systems | 17.50 |
| Cambridge Electric (NSTAR) | 17.37 |
| Public Service of New Hamp. (NU) | 16.21 |
| Bangor Hydro-Electric | 15.48 |
| Green Mountain Power | 13.95 |
| Maine Public Service | 13.00 |
| Average NE | 16.71 |
| Industrial | |
| United Illuminating | 17.71 |
| Boston Edison (NSTAR) | 17.59 |
| Narragansett Electric (Nat Grid) | 17.01 |
| Commonwealth Elec (NSTAR) | 16.45 |
| Cambridge Electric (NSTAR) | 15.45 |
| Western Mass. Electric (NU) | 15.31 |
| Connecticut Light & Power (NU) | 14.45 |
| Massachusetts Electric (Nat Grid) | 14.39 |
| Public Service of New Hamp. (NU) | 14.23 |
| Fitchburg Gas and Electric | 12.61 |
| Unitil Energy Systems | 11.44 |
| Bangor Hydro-Electric | 11.14 |
| Maine Public Service | 10.72 |
| Green Mountain Power | 9.81 |
| Average NE | 13.37 |
| Commercial | |
| Commonwealth Electric (NSTAR) | 25.57 |
| Fitchburg Gas and Electric | 20.01 |
| Boston Edison (NSTAR) | 19.02 |
| United Illuminating | 18.73 |
| Western Mass. Electric (NU) | 18.38 |
| Unitil Energy Systems | 18.24 |
| Cambridge Electric (NSTAR) | 16.98 |
| Connecticut Light & Power (NU) | 16.83 |
| Narragansett Electric (Nat Grid) | 16.82 |
| Bangor Hydro-Electric | 16.14 |
| Public Service of New Hamp. (NU) | 15.51 |
| Green Mountain Power | 14.20 |
| Massachusetts Electric (Nat Grid) | 13.94 |
| Maine Public Service | 13.09 |
| Average NE | 17.02 |
| Residential | |
| United Illuminating | 24.31 |
| Fitchburg Gas and Electric | 24.20 |
| Cambridge Electric (NSTAR) | 22.28 |
| Commonwealth Electric (NSTAR) | 22.11 |
| Boston Edison (NSTAR) | 21.41 |
| Western Mass. Electric (NU) | 20.58 |
| Connecticut Light & Power (NU) | 19.95 |
| Mass Electric (Nat Grid) | 19.01 |
| Unitil Energy Systems | 18.68 |
| Narragansett Electric (Nat Grid) | 18.31 |
| Public Service of New Hamp. (NU) | 17.88 |
| Bangor Hydro-Electric | 17.20 |
| Green Mountain Power | 16.87 |
| Maine Public Service | 14.70 |
| Average NE | 19.78 |
Green Mountain Power has lowered bills three times in the last four years and overall rates in 2015 were lower than they were in 2013, reflecting the company’s success in operating efficiently and its long-term power supply strategy.
“We are especially pleased to have kept rates stable at a time when cost pressures in New England have driven significant rate increases for other utilities, including some with double-digit increases,” Powell said.
| Average Price of Electricity to Ultimate Customers by End-Use Sector, |
| by State, March 2016 and 2015 (Cents per Kilowatthour) |
U.S. Energy Information Administration
| Residential | Commercial | Industrial | Transportation | All Sectors | ||||||
|---|---|---|---|---|---|---|---|---|---|---|
| Census Division and State |
March 2016 | March 2015 | March 2016 | March 2015 | March 2016 | March 2015 | March 2016 | March 2015 | March 2016 | March 2015 |
| New England | 19.68 | 20.84 | 15.30 | 16.94 | 12.22 | 13.01 | 8.54 | 11.35 | 16.54 | 17.93 |
| Connecticut | 20.84 | 22.02 | 16.11 | 17.32 | 13.40 | 14.32 | 11.05 | 15.86 | 17.86 | 19.16 |
| Maine | 18.80 | 15.50 | 12.26 | 13.32 | 9.12 | 10.08 | -- | -- | 14.07 | 13.01 |
| Massachusetts | 19.84 | 22.10 | 15.56 | 17.29 | 13.21 | 14.03 | 6.38 | 8.56 | 16.75 | 18.69 |
| New Hampshire | 18.46 | 19.55 | 14.57 | 16.42 | 12.40 | 14.01 | -- | -- | 15.81 | 17.45 |
| Rhode Island | 19.07 | 20.00 | 15.65 | 18.77 | 13.57 | 16.43 | 18.53 | 17.70 | 16.79 | 19.03 |
| Vermont | 17.11 | 16.66 | 14.39 | 14.29 | 10.29 | 10.15 | -- | -- | 14.43 | 14.33 |
| Middle Atlantic | 15.43 | 15.75 | 12.08 | 13.18 | 7.07 | 8.14 | 10.80 | 11.48 | 12.24 | 13.17 |
| New Jersey | 15.58 | 15.57 | 12.07 | 13.15 | 10.17 | 11.29 | 8.80 | 10.48 | 13.08 | 13.87 |
| New York | 16.89 | 19.02 | 13.58 | 15.07 | 5.99 | 7.67 | 11.62 | 12.81 | 13.76 | 15.61 |
| Pennsylvania | 14.06 | 13.16 | 9.45 | 10.01 | 7.00 | 7.85 | 8.38 | 8.27 | 10.33 | 10.60 |
| East North Central | 12.94 | 12.34 | 9.73 | 9.85 | 6.77 | 6.98 | 7.12 | 7.27 | 9.67 | 9.72 |
| Illinois | 12.56 | 11.96 | 8.65 | 9.19 | 6.29 | 6.97 | 6.90 | 6.57 | 9.03 | 9.35 |
| Indiana | 11.21 | 10.76 | 9.59 | 9.66 | 6.66 | 6.78 | 10.07 | 10.78 | 8.72 | 8.80 |
| Michigan | 14.83 | 13.81 | 10.39 | 10.35 | 6.90 | 7.12 | 11.21 | 11.35 | 10.69 | 10.59 |
| Ohio | 12.47 | 12.16 | 9.84 | 9.76 | 6.83 | 6.80 | 7.62 | 12.42 | 9.69 | 9.70 |
| Wisconsin | 14.23 | 13.96 | 10.81 | 10.85 | 7.56 | 7.61 | 15.00 | -- | 10.70 | 10.68 |
| West North Central | 11.16 | 10.41 | 8.95 | 8.61 | 6.81 | 6.57 | 8.36 | 7.94 | 9.05 | 8.64 |
| Iowa | 11.50 | 10.87 | 8.45 | 8.45 | 5.40 | 5.58 | -- | -- | 7.95 | 7.92 |
| Kansas | 13.17 | 12.05 | 10.37 | 10.04 | 7.50 | 7.32 | -- | -- | 10.31 | 9.88 |
| Minnesota | 12.23 | 11.53 | 9.46 | 8.89 | 7.07 | 6.61 | 10.03 | 9.19 | 9.64 | 9.03 |
| Missouri | 10.06 | 9.46 | 8.13 | 7.86 | 6.00 | 5.42 | 6.57 | 6.51 | 8.58 | 8.09 |
| Nebraska | 10.31 | 9.76 | 8.63 | 8.60 | 8.49 | 8.38 | -- | -- | 9.13 | 8.93 |
| North Dakota | 9.82 | 8.78 | 8.92 | 8.17 | 8.05 | 8.12 | -- | -- | 8.81 | 8.34 |
| South Dakota | 10.98 | 10.17 | 9.22 | 8.58 | 7.59 | 7.35 | -- | -- | 9.55 | 8.99 |
| South Atlantic | 11.72 | 11.44 | 9.26 | 9.66 | 5.94 | 6.37 | 7.76 | 8.18 | 9.68 | 9.92 |
| Delaware | 13.39 | 12.72 | 10.51 | 11.63 | 8.66 | 8.97 | -- | -- | 11.49 | 11.72 |
| District of Columbia | 13.24 | 12.36 | 11.58 | 12.60 | 9.06 | 8.80 | 9.37 | 10.69 | 11.80 | 12.41 |
| Florida | 11.24 | 11.63 | 9.20 | 9.81 | 7.77 | 8.31 | 8.34 | 9.05 | 10.10 | 10.64 |
| Georgia | 11.14 | 10.58 | 9.32 | 9.25 | 4.98 | 5.15 | 4.26 | 4.89 | 8.86 | 8.79 |
| Maryland | 14.36 | 13.16 | 10.96 | 11.67 | 7.84 | 9.68 | 7.83 | 8.34 | 12.25 | 12.25 |
| North Carolina | 11.66 | 11.24 | 8.52 | 8.86 | 5.37 | 6.32 | 7.74 | 7.87 | 9.16 | 9.56 |
| South Carolina | 12.86 | 12.22 | 9.90 | 10.12 | 5.42 | 5.75 | -- | -- | 9.32 | 9.38 |
| Virginia | 11.18 | 10.94 | 8.09 | 8.48 | 6.65 | 7.18 | 7.93 | 8.32 | 9.07 | 9.47 |
| West Virginia | 11.00 | 9.62 | 9.55 | 8.71 | 6.47 | 5.98 | -- | -- | 8.75 | 8.02 |
| East South Central | 10.68 | 10.43 | 10.04 | 10.25 | 5.48 | 5.68 | -- | -- | 8.68 | 8.84 |
| Alabama | 12.11 | 11.78 | 10.91 | 10.92 | 5.61 | 5.65 | -- | -- | 9.12 | 9.11 |
| Kentucky | 10.05 | 9.70 | 9.39 | 9.36 | 5.23 | 5.20 | -- | -- | 7.91 | 7.86 |
| Mississippi | 10.91 | 11.11 | 9.79 | 10.96 | 5.64 | 6.45 | -- | -- | 8.62 | 9.55 |
| Tennessee | 10.01 | 9.79 | 9.92 | 10.03 | 5.49 | 5.82 | -- | -- | 8.91 | 9.03 |
| West South Central | 10.68 | 10.72 | 7.65 | 8.04 | 5.20 | 5.64 | 5.69 | 5.58 | 7.82 | 8.35 |
| Arkansas | 9.62 | 9.02 | 7.96 | 7.84 | 5.54 | 5.65 | 9.22 | 11.33 | 7.68 | 7.69 |
| Louisiana | 9.14 | 8.81 | 8.90 | 8.74 | 5.21 | 5.43 | 9.28 | 8.77 | 7.44 | 7.61 |
| Oklahoma | 10.24 | 9.51 | 6.72 | 7.35 | 4.44 | 5.06 | -- | -- | 7.17 | 7.51 |
| Texas | 11.25 | 11.63 | 7.55 | 8.02 | 5.28 | 5.79 | 5.41 | 5.35 | 8.03 | 8.74 |
| Mountain | 11.30 | 11.43 | 9.09 | 9.46 | 5.87 | 6.27 | 9.38 | 9.91 | 8.76 | 9.08 |
| Arizona | 11.75 | 11.51 | 9.75 | 9.68 | 5.40 | 5.94 | 8.33 | 7.39 | 9.45 | 9.57 |
| Colorado | 11.35 | 11.73 | 8.99 | 9.73 | 6.71 | 6.92 | 9.04 | 10.23 | 9.13 | 9.57 |
| Idaho | 9.80 | 9.59 | 7.66 | 7.77 | 5.98 | 5.96 | -- | -- | 8.05 | 7.90 |
| Montana | 10.92 | 10.63 | 10.24 | 10.30 | 4.74 | 5.02 | -- | -- | 8.89 | 8.93 |
| Nevada | 12.28 | 13.62 | 8.30 | 9.73 | 4.82 | 6.10 | 7.47 | 8.68 | 7.95 | 9.14 |
| New Mexico | 11.44 | 12.11 | 9.36 | 10.11 | 5.78 | 6.25 | -- | -- | 8.65 | 9.40 |
| Utah | 10.67 | 10.49 | 8.25 | 8.28 | 6.04 | 5.90 | 10.14 | 9.99 | 8.24 | 8.18 |
| Wyoming | 10.85 | 10.61 | 9.39 | 9.16 | 6.98 | 7.04 | -- | -- | 8.19 | 8.20 |
| Pacific Contiguous | 14.16 | 13.76 | 12.33 | 12.34 | 8.10 | 8.04 | 8.92 | 8.17 | 12.04 | 11.86 |
| California | 17.66 | 17.04 | 13.83 | 13.91 | 10.39 | 10.74 | 8.91 | 8.13 | 14.34 | 14.28 |
| Oregon | 10.42 | 10.49 | 8.87 | 8.86 | 5.80 | 5.96 | 9.21 | 9.23 | 8.83 | 8.77 |
| Washington | 9.22 | 8.67 | 8.48 | 8.23 | 4.40 | 4.30 | 9.84 | 9.25 | 7.74 | 7.28 |
| Pacific Noncontiguous | 23.96 | 25.49 | 20.89 | 22.86 | 18.57 | 21.21 | -- | -- | 21.03 | 23.13 |
| Alaska | 20.06 | 19.64 | 17.66 | 17.56 | 15.35 | 14.62 | -- | -- | 17.92 | 17.65 |
| Hawaii | 27.35 | 30.87 | 23.99 | 27.97 | 19.86 | 23.79 | -- | -- | 23.24 | 27.12 |
| U.S. Total | 12.58 | 12.34 | 10.13 | 10.52 | 6.47 | 6.81 | 9.43 | 10.18 | 10.01 | 10.27 |
See Technical notes for additional information on the Commercial, Industrial, and Transportation sectors.
Notes: - See Glossary for definitions. - Values are preliminary estimates based on a cutoff model sample.
See Technical Notes for a discussion of the sample design for the Form EIA-826.
Utilities and energy service providers may classify commercial and industrial customers based on either NAICS codes or demands or usage falling within specified limits by rate schedule.
Changes from year to year in consumer counts, sales and revenues, particularly involving the commercial and industrial consumer sectors, may result from respondent implementation of changes in the definitions of consumers, and reclassifications.
Totals may not equal sum of components because of independent rounding.
Source: U.S. Energy Information Administration, Form EIA-826, Monthly Electric Sales and Revenue Report with State Distributions Report.
Source: GMP 5.25.2016. U.S. Energy Information Administration, March 2016