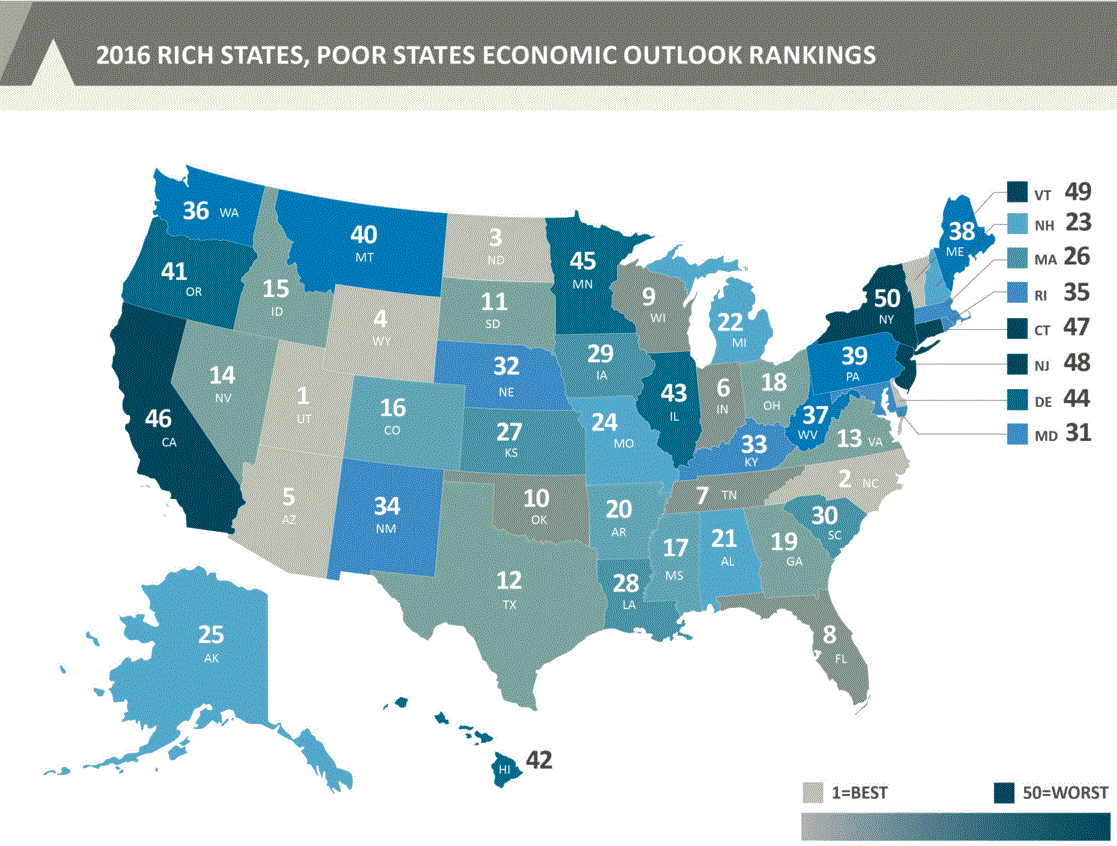
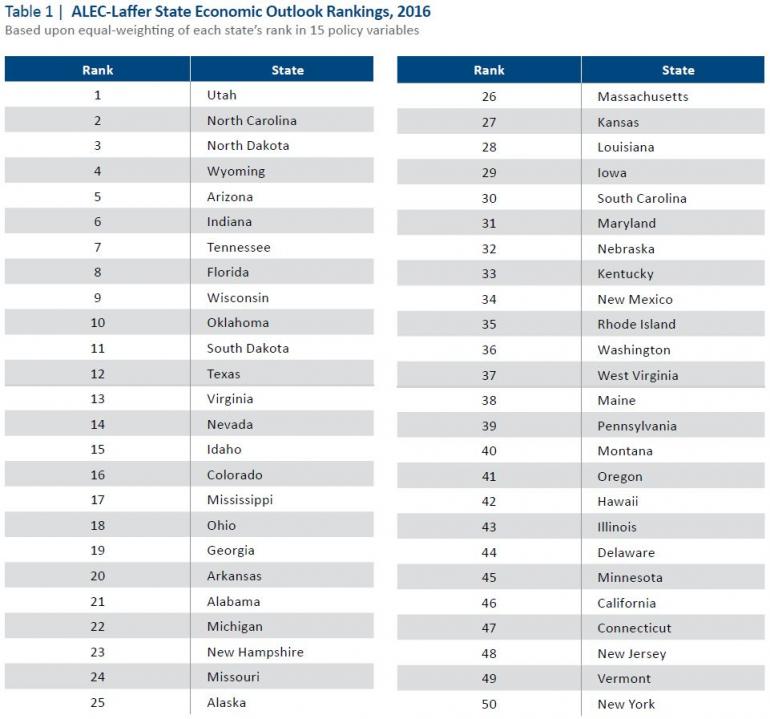
Vermont Business Magazine Vermont once again finished 49th on "2016 Rich States, Poor States" national ranking. New York was 50th. Vermont and New York consistently have competed for the bottom two spots over the years. Utah earned the top spot for states with the best economic outlook, followed by North Carolina, North Dakota and Wyoming, according to the newest edition of the ranking recently released by the American Legislative Exchange Council (ALEC).
The report also revealed many states significantly improved or fell in the rankings. Tennessee was the biggest winner in the rankings this year, climbing 10 spots to seventh place. Florida gained seven spots in the rankings, while New Hampshire and Oklahoma improved by six spots. New Hampshire (23) was the only Northeast state in the top half of the ranking. On the other hand, Georgia was the biggest loser this year, dropping 12 spots in the rankings to 19th place. Alaska fell by 11 spots, while Idaho and Kansas lost nine spots.
The lead author of the now ninth edition (2007-2015 data) of the ranking is Reagan-era economist Arthur Laffer. The report, despite its title, is not a snapshot of current economic performance, but of future expectations, based mainly on state tax policy. Most of the wealthiest states (based on median household income) are lower down on the "Rich States" ranking and have been since its inception. Vermont, for instance, has a higher relative household median income now than it had at the beginning of the ranking, despite being what "Rich States" would suggest is a "poor" one.
 Vermont's household income was $61,036 in 2006 (2014 dollars, the most recent data available from the US Census) or $4,438 above the US median, fell during the Great Recession, peaked in 2013 at $66,585, or $12,123 above the US median (in the course of this report the US peaked in 2007 at $57,357 Vermont was $54,111 in 2007; the US historic peak of $57,843 was achieved in 1999) and in 2014 Vermont was $60,708, or $7,051 above the US median. Vermont only edged above the US median in the early 1980s and has been generally above the US median since, with 2007 being the last time the state was below.
As with Vermont, the wealthier states tend to have higher taxes and higher costs of living than the states with lower incomes. The "Rich States" in this ranking tend to have mid-range incomes and low taxes. New Hampshire again being the outlier.
The cover shot shows emblems from the "Rich" states backdropped by the Rockies, while those of the "Poor" states are submerged in what can be guessed as the Great Salt Lake.
The 15 economic policy variables used by the authors to rank the economic outlook of states have shown over time to be among the most influential drivers of state growth. The top ten and bottom ten states for 2016 are:
Overall Economic Outlook for 2016
(with Median Household Income Ranking)
| Top Ten | Bottom Ten |
| 1. Utah (12) 2. North Carolina (42) 3. North Dakota (15) 4. Wyoming (14) 5. Arizona (32) 6. Indiana (35) 7. Tennessee (43) 8. Florida (38) 9. Wisconsin (19) 10. Oklahoma (36) |
41. Oregon (20) 42. Hawaii (11) 43. Illinois (21) 44. Delaware (23) 45. Minnesota (8) 46. California (13) 47. Connecticut (3) 48. New Jersey (5) 49. Vermont (17) 50. New York (26) |
“2015 was another banner year for tax cuts in many statehouses around the country,” said Jonathan Williams, co-author of the report and vice president of the ALEC Center for State Fiscal Reform. “As states compete with each other for much-needed human and financial capital, there is a clear trend in favor of taxpayer-friendly, market-oriented reforms.”
Rich States, Poor States examines the latest movements in state economic growth. The data ranks the 2016 economic outlook of states using 15 equally weighted policy variables, including various tax rates, regulatory burdens and labor policies. The ninth edition examines trends over the last few decades that have helped or hurt states’ economies.
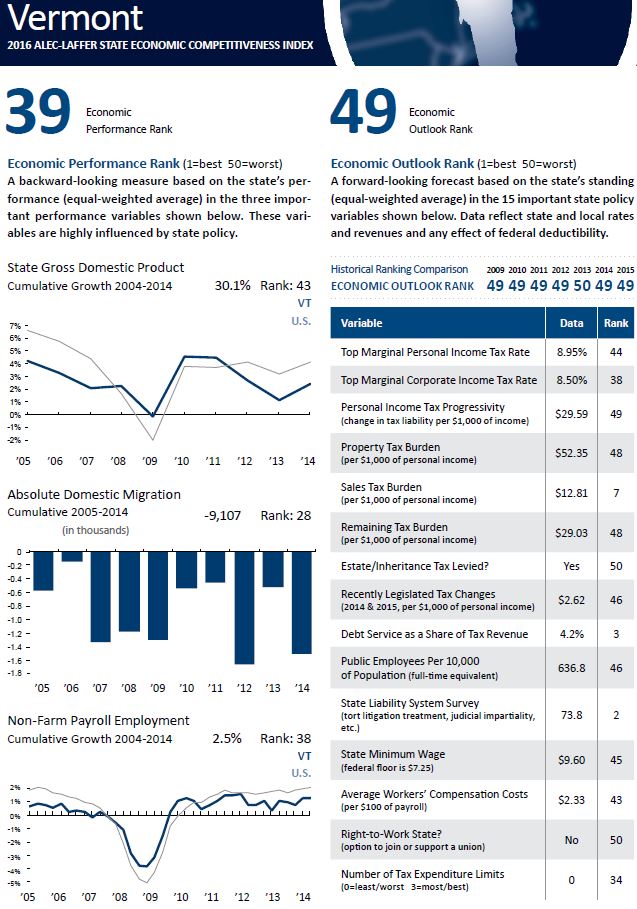
While most of the data are based on actual tax numbers, "Right to Work" question, based on whether a worker must join a union if part of the bargaining unit, was a yes or no question. "Yes" was weighted as 1 and "No" 50. Vermont is a "No." New Hampshire is also a "No," which explains why it is not higher on the list. If New Hampshire were a "Yes" state, it would have been in the Top 10.
ALEC endeavors to influence state lawmakers to lower taxes and business costs. Since 2008, Rich States, Poor States: ALEC-Laffer State Economic Competitiveness Index, is authored by economist Dr. Arthur B. Laffer; Stephen Moore, distinguished visiting fellow at the Heritage Foundation; and Jonathan Williams, vice president of the ALEC Center for State Fiscal Reform.
Arlington, VA (April 12, 2016) — American Legislative Exchange Council