 Vermont Business Magazine Each of the three key metrics showed improvement as the March unemployment rate fell one-tenth to 3.3 percent. The Labor Market and Employed increased, while the number of Unemployed decreased. The Vermont Department of Labor announced the seasonally-adjusted statewide unemployment rate today. The national rate in March was 5.0 percent. As of the prior month’s initial data, the Burlington-South Burlington Metropolitan NECTA, at 2.6 percent, had the lowest unemployment rate in the country for all metropolitan areas. Overall, Vermont’s unemployment rate was tied for seventh lowest in the country. Northern New England rates were among the lowest in the nation. New Hampshire was second at 2.6 percent and Maine was eighth at 3.4 percent. South Dakota was overall lowest at 2.5 percent and Alaska was highest at 6.6 percent.
March is the eighth consecutive month reporting a decline to the number of unemployed persons in Vermont (seasonally-adjusted).
The seasonally-adjusted Vermont data for March show the Vermont civilian labor force increased by 700 from the prior month’s revised estimate. The number of employed increased by 850 and the number of unemployed decreased by 200. None of the over-the-month changes were statistically significant in the seasonally-adjusted series. The Labor Force again was down year-to-year, as was the number of Unemployed, while the number of Employed showed a small increase.
“The national and Vermont economies continue to add jobs, and this prolonged period of economic growth, combined with demographic factors, make this a good time for people to find employment and new career opportunities. VDOL sponsors numerous training programs in Vermont which prepare participants for jobs through specific job training programs, industry recognized credentials, internships, pre-and-registered apprenticeships, certifications and academic careers. These programs prepare individuals for job opportunities here in Vermont. In addition, high school and college students need to be applying for summer internships and jobs, and recent graduates should visit a local VDOL Office to register and get help finding jobs. Vermont employers are hiring at all levels of skills and experience”, said Labor Commissioner Annie Noonan.
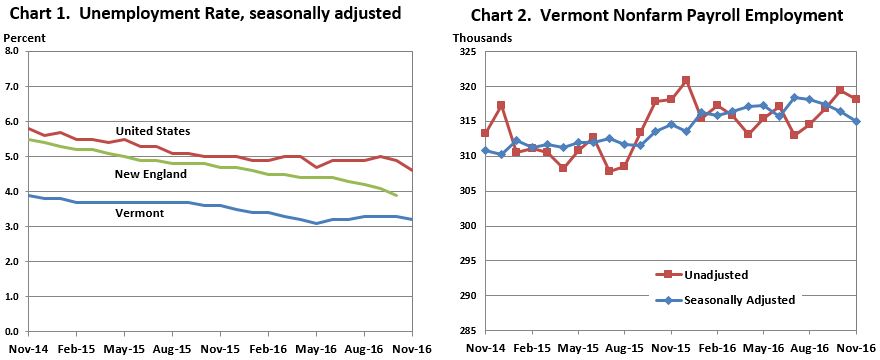 Nonfarm Payroll. See technical note below.
The March unemployment rates for Vermont’s 17 labor market areas ranged from 2.6 percent in Burlington-South Burlington to 6.9 percent in Derby (note: local labor market area unemployment rates are not seasonally-adjusted). For comparison, the March unadjusted unemployment rate for Vermont was 3.5 percent which reflects a decrease of two-tenths of one percentage point from the revised unadjusted February level and a decrease of five-tenths of one percentage point from a year ago.
Not-Seasonally-Adjusted
The preliminary ‘not-seasonally-adjusted’ jobs estimates for March show a decrease of 1,800 jobs when compared to the revised February numbers. There was no change between the preliminary and the revised February estimates due to the inclusion of more data. The monthly decrease seen in the March numbers was attributable to the end of the winter season and its impact on leisure and hospitality employment. The broader economic trends can be detected by focusing on the over-the-year changes in this data series. As detailed in the preliminary ‘not-seasonally-adjusted’ March data, Total Private industries have increased by 4,000 jobs (1.6 percent) and Government (including public education) employment has increased by 1,000 jobs (1.7 percent) in the past year.
Seasonally-Adjusted
The seasonally-adjusted data for March reports an increase of 200 jobs from the revised February data. As with the ‘not-seasonally-adjusted’ data, this over-the-month change is from the revised February numbers which experienced a 100 job decrease from the preliminary estimates. The seasonally-adjusted over-the-month changes in March were varied at the sectorial level. Those with a notable percent increase include: Construction (+400 jobs or +2.5%), Professional and Technical Services (+200 jobs or +1.4%), and Finance and Insurance (+100 jobs or +1.1%). Industries with a notable percent decrease include: Administrative and Waste Services (-300 jobs or -2.7%), Accommodation and Food Services (-800 jobs or -2.5%), and Durable Goods Manufacturing (-300 jobs or -1.6%).
Burlington-South Burlington, had the lowest unemployment rate in February, 2.6 percent. El Centro, Calif., had the highest unemployment rate, 18.6 percent. A total of 190 areas had February jobless rates below the U.S. rate of 5.2 percent, 187 areas had rates above it, and 10 areas had rates equal to that of the nation.
NOTE: Employment (nonfarm payroll) - A count of all persons who worked full- or part-time or received pay from a nonagricultural employer for any part of the pay period which included the 12th of the month. Because this count comes from a survey of employers, persons who work for two different companies would be counted twice. Therefore, nonfarm payroll employment is really a count of the number of jobs, rather than the number of persons employed. Persons may receive pay from a job if they are temporarily absent due to illness, bad weather, vacation, or labor-management dispute. This count is based on where the jobs are located, regardless of where the workers reside, and is therefore sometimes referred to as employment "by place of work." Nonfarm payroll employment data are collected and compiled based on the Current Employment Statistics (CES) survey, conducted by the Vermont Department of Labor. This count was formerly referred to as nonagricultural wage and salary employment.
| Unemployment Rates for States Monthly Rankings Seasonally Adjusted Mar. 2016p |
||
|---|---|---|
| Rank | State | Rate |
| 1 | SOUTH DAKOTA | 2.5 |
| 2 | NEW HAMPSHIRE | 2.6 |
| 3 | COLORADO | 2.9 |
| 4 | NEBRASKA | 3.0 |
| 5 | HAWAII | 3.1 |
| 5 | NORTH DAKOTA | 3.1 |
| 7 | VERMONT | 3.3 |
| 8 | MAINE | 3.4 |
| 9 | UTAH | 3.5 |
| 10 | MINNESOTA | 3.7 |
| 11 | IDAHO | 3.8 |
| 11 | IOWA | 3.8 |
| 13 | KANSAS | 3.9 |
| 14 | ARKANSAS | 4.0 |
| 14 | VIRGINIA | 4.0 |
| 16 | MISSOURI | 4.2 |
| 17 | MONTANA | 4.3 |
| 17 | TEXAS | 4.3 |
| 19 | DELAWARE | 4.4 |
| 19 | MASSACHUSETTS | 4.4 |
| 19 | NEW JERSEY | 4.4 |
| 19 | OKLAHOMA | 4.4 |
| 23 | OREGON | 4.5 |
| 23 | TENNESSEE | 4.5 |
| 23 | WISCONSIN | 4.5 |
| 26 | MARYLAND | 4.7 |
| 27 | MICHIGAN | 4.8 |
| 27 | NEW YORK | 4.8 |
| 29 | FLORIDA | 4.9 |
| 29 | PENNSYLVANIA | 4.9 |
| 31 | INDIANA | 5.0 |
| 32 | OHIO | 5.1 |
| 33 | WYOMING | 5.2 |
| 34 | ARIZONA | 5.4 |
| 34 | CALIFORNIA | 5.4 |
| 34 | RHODE ISLAND | 5.4 |
| 37 | GEORGIA | 5.5 |
| 37 | NORTH CAROLINA | 5.5 |
| 39 | KENTUCKY | 5.6 |
| 40 | CONNECTICUT | 5.7 |
| 40 | SOUTH CAROLINA | 5.7 |
| 42 | NEVADA | 5.8 |
| 42 | WASHINGTON | 5.8 |
| 44 | LOUISIANA | 6.1 |
| 45 | ALABAMA | 6.2 |
| 45 | NEW MEXICO | 6.2 |
| 47 | MISSISSIPPI | 6.3 |
| 48 | DISTRICT OF COLUMBIA | 6.5 |
| 48 | ILLINOIS | 6.5 |
| 48 | WEST VIRGINIA | 6.5 |
| 51 | ALASKA | 6.6 |
p = preliminary.
NOTE: Rates shown are a percentage of the labor force. Data refer to place of residence. Estimates for the current month are subject to revision the following month.
Last Modified Date: April 15, 2016