Vermont Business Magazine Even while the unemployment rate in February showed no change from last month, the overall news was generally positive, with a greater labor force, more employed and fewer jobless. The Vermont Department of Labor announced today that the seasonally-adjusted statewide unemployment rate for February was 3.4 percent. This represents no change from the revised January rate. The national average in February was 4.9 percent. Vermont’s unemployment rate is tied for seventh lowest in the country. New Hampshire is tied for lowest with South Dakota at 2.7 percent. February is the seventh consecutive month reporting a decline to the number of unemployed persons in Vermont.
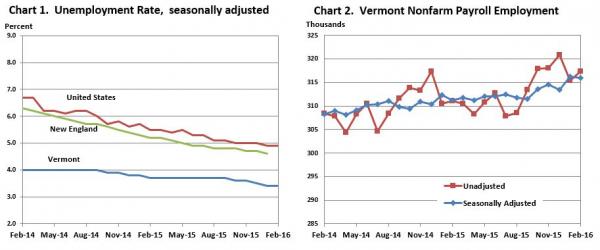 The chart represents Vermont Nonfarm employment, see tables below.
The seasonally-adjusted Vermont data for February show the Vermont civilian labor force increased by 600 from the prior month’s revised estimate. The number of employed increased by 750 and the number of unemployed decreased by 150. None of the over-the-month changes were statistically significant in the seasonally-adjusted series.
The February unemployment rates for Vermont’s 17 labor market areas ranged from 2.6 percent in Burlington-South Burlington to 7.5 percent in Derby (note: local labor market area unemployment rates are not seasonally-adjusted). For comparison, the February unadjusted unemployment rate for Vermont was 3.6 percent which reflects a decrease of four-tenths of a percentage point from the revised unadjusted January level and a decrease of four-tenths of a percentage point from a year ago.
“Though the pace of this economic recovery has been historically slow, Vermont continues to be in a period of economic growth. We have many educational and job programs to help Vermonters prepare for work, train for specific jobs, or continue their education. The Vermont Department of Labor has many resources to help both employers who need workers and Vermonters who need jobs. There are many opportunities for those looking to start or advance a career in Vermont. The Department of Labor has 12 regional offices in Vermont, and employers and job-seekers should call or visit an office to learn about our services”, said Labor Commissioner Annie Noonan.
Not-Seasonally-Adjusted
The preliminary ‘not-seasonally-adjusted’ jobs estimates for February show an increase of 1,900 jobs when compared to the revised January numbers. There was an increase of 100 jobs between the preliminary and the revised January estimates due to the inclusion of more data. The monthly increase seen in the February numbers was attributable to education across both the public and private sectors. The broader economic trends can be detected by focusing on the over-the-year changes in this data series. As detailed in the preliminary ‘not-seasonally-adjusted’ February data, Total Private industries have increased by 5,200 jobs (2.1 percent) and Government employment has increased by 1,000 jobs (1.7 percent) in the past year.
Compared to February of last year, however, while the number of unemployed is down dramatically so too are the number of employed and the total labor force, presenting a negative trend. The ski season also suffered significantly this year, which also impacted employment and jobs compared to the record season from last year.
Seasonally-Adjusted
The seasonally-adjusted data for February reports a decrease of 300 jobs from the revised January data. As with the ‘not-seasonally-adjusted’ data, this over-the-month change is from the revised January numbers which experienced a 100 job increase from the preliminary estimates. The seasonally-adjusted over-the-month changes in February were varied at the sectorial level. Those with a notable percent increase include: Construction (+200 jobs or +1.2%), Leisure and Hospitality (+300 jobs or +0.8%), and Private Educational Services (+100 jobs or +0.8%). Industries with a notable percent decrease include: State Government (-500 jobs or -2.5%), Financial Activities (-200 jobs or -1.6%), and Federal Government (-100 jobs or -1.4%).


| Unemployment Rates for States Monthly Rankings Seasonally Adjusted Feb. 2016p |
||
|---|---|---|
| Rank | State | Rate |
| 1 | NEW HAMPSHIRE | 2.7 |
| 1 | SOUTH DAKOTA | 2.7 |
| 3 | NORTH DAKOTA | 2.9 |
| 4 | COLORADO | 3.0 |
| 4 | NEBRASKA | 3.0 |
| 6 | HAWAII | 3.1 |
| 7 | UTAH | 3.4 |
| 7 | VERMONT | 3.4 |
| 9 | MAINE | 3.6 |
| 10 | IOWA | 3.7 |
| 10 | MINNESOTA | 3.7 |
| 12 | IDAHO | 3.9 |
| 13 | KANSAS | 4.0 |
| 14 | VIRGINIA | 4.1 |
| 15 | ARKANSAS | 4.2 |
| 15 | MISSOURI | 4.2 |
| 15 | MONTANA | 4.2 |
| 15 | OKLAHOMA | 4.2 |
| 19 | NEW JERSEY | 4.3 |
| 20 | TEXAS | 4.4 |
| 21 | MASSACHUSETTS | 4.5 |
| 22 | DELAWARE | 4.6 |
| 22 | PENNSYLVANIA | 4.6 |
| 22 | WISCONSIN | 4.6 |
| 25 | INDIANA | 4.7 |
| 25 | MARYLAND | 4.7 |
| 27 | MICHIGAN | 4.8 |
| 27 | NEW YORK | 4.8 |
| 27 | OREGON | 4.8 |
| 30 | FLORIDA | 4.9 |
| 30 | OHIO | 4.9 |
| 30 | TENNESSEE | 4.9 |
| 33 | WYOMING | 5.0 |
| 34 | GEORGIA | 5.4 |
| 34 | RHODE ISLAND | 5.4 |
| 36 | ARIZONA | 5.5 |
| 36 | CALIFORNIA | 5.5 |
| 36 | CONNECTICUT | 5.5 |
| 36 | NORTH CAROLINA | 5.5 |
| 36 | SOUTH CAROLINA | 5.5 |
| 41 | KENTUCKY | 5.8 |
| 41 | WASHINGTON | 5.8 |
| 43 | LOUISIANA | 5.9 |
| 43 | NEVADA | 5.9 |
| 45 | ALABAMA | 6.2 |
| 46 | ILLINOIS | 6.4 |
| 46 | NEW MEXICO | 6.4 |
| 48 | DISTRICT OF COLUMBIA | 6.5 |
| 48 | MISSISSIPPI | 6.5 |
| 48 | WEST VIRGINIA | 6.5 |
| 51 | ALASKA | 6.6 |
p = preliminary.
NOTE: Rates shown are a percentage of the labor force. Data refer to place of residence. Estimates for the current month are subject to revision the following month.