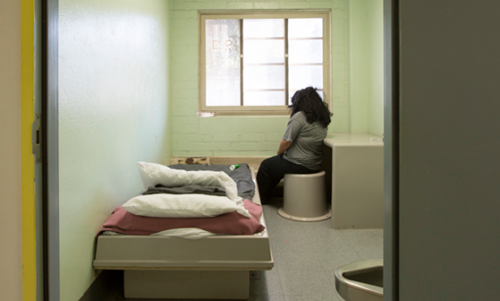
Vermont Business Magazine While Vermont has the lowest rate in the nation, at about a quarter of the US average, a change is under way in the nation's approach to dealing with youth incarceration. Although the United States still leads the industrialized world in the rate at which it locks up young people, the youth confinement rate in the US is rapidly declining. According to research undertaken by the Annie E Casey Foundation: Youth prisons and correctional facilities are dangerous, ineffective and unnecessary. But the good news is that America’s youth confinement rate dropped across all racial and ethnic groups during the last decade — and by 40 percent overall. While these numbers are moving in the right direction, there’s clear room for improvement, according to statistics from the KIDS COUNT Data Center. In 2013, the last full year for which data is available, America still placed more than 54,000 youth in juvenile detention, correctional and residential facilities.
 Equally important, the US lockup pattern is rife with racial inequities. Here’s what the data says:
- In every state across the country, black youth run a greater risk of being placed in confinement compared to their white peers.
- Relative to white kids, national confinement rates are
- Nearly twice as high for Hispanic youth.
- Three times higher for American Indian youth.
- And about five times higher for black youth.
- The two racial groups with the highest youth lockup rates—blacks and American Indians—saw the smallest cuts to confinement over the last decade.
- In six states, the confinement rate is more than 10 times higher for black kids than it is for white kids. This inequality is greatest in New Hampshire, where black youth are 36 times more likely to be locked up relative to their white counterparts.
Values include persons under age 21 who had been (1) charged with or adjudicated for an offense; (2) assigned a bed in a facility that can hold accused or convicted juvenile offenders; and (3) placed in the facility because of the offense. CJRP does not capture data on juveniles held in adult prisons or jails. Values include both pre-adjudicated and post-adjudicated individuals. CJRP does not include facilities exclusively intended for drug or mental health treatment even though such facilities may house some offenders. There may, however, be numerous juveniles in residential placement captured by CJRP that were receiving such treatment. State refers to the state where the offense occurred.
| Location | Data Type | 2013 |
|---|---|---|
| Location | Data Type | 2013 |
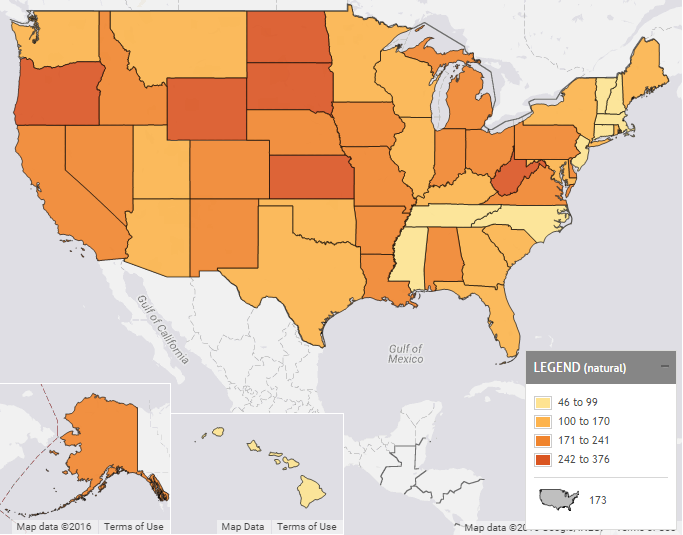
| United States | Rate per 100,000 | 173 |
| Alabama | Rate per 100,000 | 184 |
| Alaska | Rate per 100,000 | 241 |
| Arizona | Rate per 100,000 | 122 |
| Arkansas | Rate per 100,000 | 215 |
| California | Rate per 100,000 | 197 |
| Colorado | Rate per 100,000 | 197 |
| Connecticut | Rate per 100,000 | 74 |
| Delaware | Rate per 100,000 | 176 |
| District of Columbia | Rate per 100,000 | 560 |
| Florida | Rate per 100,000 | 152 |
| Georgia | Rate per 100,000 | 159 |
| Hawaii | Rate per 100,000 | 60 |
| Idaho | Rate per 100,000 | 236 |
| Illinois | Rate per 100,000 | 134 |
| Indiana | Rate per 100,000 | 219 |
| Iowa | Rate per 100,000 | 227 |
| Kansas | Rate per 100,000 | 278 |
| Kentucky | Rate per 100,000 | 170 |
| Louisiana | Rate per 100,000 | 180 |
| Maine | Rate per 100,000 | 130 |
| Maryland | Rate per 100,000 | 127 |
| Massachusetts | Rate per 100,000 | 60 |
| Michigan | Rate per 100,000 | 183 |
| Minnesota | Rate per 100,000 | 165 |
| Mississippi | Rate per 100,000 | 74 |
| Missouri | Rate per 100,000 | 191 |
| Montana | Rate per 100,000 | 151 |
| Nebraska | Rate per 100,000 | 204 |
| Nevada | Rate per 100,000 | 201 |
| New Hampshire | Rate per 100,000 | 68 |
| New Jersey | Rate per 100,000 | 95 |
| New Mexico | Rate per 100,000 | 179 |
| New York | Rate per 100,000 | 116 |
| North Carolina | Rate per 100,000 | 70 |
| North Dakota | Rate per 100,000 | 253 |
| Ohio | Rate per 100,000 | 186 |
| Oklahoma | Rate per 100,000 | 125 |
| Oregon | Rate per 100,000 | 281 |
| Pennsylvania | Rate per 100,000 | 222 |
| Rhode Island | Rate per 100,000 | 158 |
| South Carolina | Rate per 100,000 | 159 |
| South Dakota | Rate per 100,000 | 376 |
| Tennessee | Rate per 100,000 | 99 |
| Texas | Rate per 100,000 | 161 |
| Utah | Rate per 100,000 | 160 |
| Vermont | Rate per 100,000 | 46 |
| Virginia | Rate per 100,000 | 188 |
| Washington | Rate per 100,000 | 144 |
| West Virginia | Rate per 100,000 | 294 |
| Wisconsin | Rate per 100,000 | 156 |
| Wyoming | Rate per 100,000 | 279 |
| Location | Race Group | Data Type | 2006 | 2007 | 2010 | 2011 | 2013 |
|---|---|---|---|---|---|---|---|
| United States | American Indian | Number | 1,703 | 1,464 | 1,236 | 1,191 | 1,078 |
| Rate per 100,000 | 476 | 416 | 369 | 361 | 334 | ||
| Asian | Number | 1,155 | 1,035 | 728 | 566 | 476 | |
| Rate per 100,000 | 80 | 71 | 47 | 35 | 28 | ||
| Black | Number | 37,334 | 35,447 | 28,977 | 24,574 | 21,550 | |
| Rate per 100,000 | 743 | 714 | 606 | 520 | 464 | ||
| Hispanic | Number | 19,027 | 18,056 | 15,590 | 13,973 | 12,291 | |
| Rate per 100,000 | 309 | 284 | 228 | 202 | 173 | ||
| White | Number | 32,490 | 29,534 | 22,947 | 19,927 | 17,563 | |
| Rate per 100,000 | 170 | 157 | 128 | 112 | 100 | ||
| Other | Number | 1,012 | 1,278 | 1,315 | 1,192 | 1,190 | |
| Rate per 100,000 | N.A. | N.A. | N.A. | N.A. | N.A. | ||
| Total | Number | 92,721 | 86,814 | 70,793 | 61,423 | 54,148 | |
| Rate per 100,000 | 289 | 272 | 225 | 196 | 173 |
| Vermont | American Indian | Number | 0 | 0 | 0 | 0 | 3 |
| Rate per 100,000 | 0 | 0 | 0 | 0 | 1,010 | ||
| Asian | Number | 0 | 0 | 0 | 0 | 0 | |
| Rate per 100,000 | 0 | 0 | 0 | 0 | 0 | ||
| Black | Number | 3 | 0 | 0 | 0 | 3 | |
| Rate per 100,000 | 264 | 0 | 0 | 0 | 195 | ||
| Hispanic | Number | 6 | 0 | 12 | 0 | 0 | |
| Rate per 100,000 | 518 | 0 | 931 | 0 | 0 | ||
| White | Number | 45 | 42 | 18 | 33 | 21 | |
| Rate per 100,000 | 69 | 66 | 31 | 58 | 38 | ||
| Other | Number | 0 | 0 | 0 | 3 | 0 | |
| Rate per 100,000 | N.A. | N.A. | N.A. | N.A. | N.A. | ||
| Total | Number | 54 | 45 | 33 | 36 | 27 | |
| Rate per 100,000 | 78 | 67 | 53 | 59 | 46 |
Data Source: Sickmund, Melissa, Sladky, T.J., Kang, Wei, and Puzzanchera, C. (2015) "Easy Access to the Census of Juveniles in Residential Placement." Online Author's analysis of OJJDP's Census of Juveniles in Residential Placement 1997, 1999, 2001, 2003, 2006, 2007, 2010, 2011 and 2013 [machine-readable data files].
Available: http://www.ojjdp.gov/ojstatbb/ezacjrp/