Vermont Business Magazine HNI Corporation(NYSE: HNI), based in Iowa, has announced sales for the fourth quarter ended January2, 2016, of$596.9 millionand net income of$32.2 million, or$0.71per diluted share.Non-GAAP net income per diluted share improved 40 percent from the prior year quarter to $0.91, which excludes restructuring, goodwill and intangible impairment and transition costs.The Vermont Castings Group acquisition increased sales$62.7 million. HNI acquired Vermont Castings from its Kentucky-based owner in 2014. It subsequently closed the Bethel assembly plant in 2015, while the Randolph foundry remains in operation.
Fourth Quarter and Year End Summary Comments
"We delivered double digit earnings growth in the fourth quarter despite a challenging economic environment. I'm pleased with our results in 2015 and the strong profit growth we've delivered over the last several years of modest economic recovery. We continue to compete well in our markets. We remain focused on executing operational performance improvements and reducing structural costs to drive long-term shareholder value," saidStan Askren, HNI Corporation Chairman, President and Chief Executive Officer.
RELATED STORY:
HNI Corporation acquires Vermont Castings
Fourth Quarter Highlights
- Non-GAAP net income per share increased 40 percent to $0.91 on a sales decrease of 7.7 percent; GAAP net income per share $0.71
- Non-GAAP gross profit increased 220 basis points; GAAP gross profit increased 240 basis points
Fiscal Year Highlights
- Non-GAAP net income per share increased 31 percent to $2.58 on a sales increase of 3.7 percent; GAAP net income per share $2.32
- Non-GAAP gross profit increased 130 basis points; GAAP gross profit increased 150 basis points
| Fourth Quarter - Financial Performance | ||||||
| (Dollars in millions, except per share data) | ||||||
| Three Months Ended | ||||||
| 1/2/2016 | 1/3/2015 | Change | ||||
| GAAP | ||||||
| Net Sales | $596.9 | $646.7 | -7.7% | |||
| Gross Profit % | 37.7% | 35.3% | 240bps | |||
| SG&A % | 27.8% | 28.2% | -40bps | |||
| (Gain) loss on sale of assets % | 0.0% | -0.2% | 20bps | |||
| Restructuring and impairment charges % | 2.0% | 3.4% | -140bps | |||
| Operating Income | $47.8 | $24.8 | 92.4% | |||
| Operating Income % | 8.0% | 3.8% | 420bps | |||
| Net Income % | 5.4% | 1.1% | 430bps | |||
| EPS – diluted | $0.71 | $0.16 | 343.8% | |||
| Non-GAAP | ||||||
| Gross Profit % | 37.9% | 35.7% | 220bps | |||
| Operating Income | $60.5 | $48.4 | 25.1% | |||
| Operating Income % | 10.1% | 7.5% | 260bps | |||
| EPS – diluted | $0.91 | $0.65 | 40.0% | |||
Fourth Quarter Summary Comments
- Consolidated net sales decreased$49.8 millionor 7.7 percent to$596.9 million.
- Non-GAAP gross margin increased 220 basis points compared to prior year driven by strong operational performance, structural cost reductions, favorable material costs and price realization, partially offset by lower volume.
- Selling and administrative expenses, as a percentage of sales, decreased 40 basis points due to cost reductions and lower incentive based compensation.
- The Corporation recorded$12.7 millionof restructuring and impairment charges and transition costs. These costs included goodwill and intangible impairment charges of$11.2 millionrelated to a small office furniture business and$1.5 millionof restructuring and transition costs in connection with previously announced closures, acquisition integration and structural realignment. Fourth quarter 2014 included$24.5 millionof restructuring and impairment charges and transition costs.
| Full Year - Financial Performance | ||||||
| (Dollars in millions, except per share data) | ||||||
| Twelve Months Ended | ||||||
| 1/2/2016 | 1/3/2015 | Change | ||||
| GAAP | ||||||
| Net Sales | $2,304.4 | $2,222.7 | 3.7% | |||
| Gross Profit % | 36.8% | 35.3% | 150bps | |||
| SG&A % | 29.2% | 29.2% | — | |||
| (Gain) loss on sale of assets % | 0.0% | -0.5% | 50bps | |||
| Restructuring and impairment charges % | 0.5% | 1.5% | -100bps | |||
| Operating Income | $163.7 | $112.8 | 45.0% | |||
| Operating Income % | 7.1% | 5.1% | 200bps | |||
| Net Income % | 4.6% | 2.8% | 180bps | |||
| EPS – diluted | $2.32 | $1.35 | 71.9% | |||
| Non-GAAP | ||||||
| Gross Profit % | 37.0% | 35.7% | 130bps | |||
| Operating Income | $180.9 | $145.3 | 24.6% | |||
| Operating Income % | 7.9% | 6.5% | 140bps | |||
| EPS – diluted | $2.58 | $1.97 | 31.0% | |||
Full Year Summary Comments
- Consolidated net sales increased$81.7 millionor 3.7 percent to$2.3 billion. Compared to prior year, the Vermont Castings Group acquisition increased sales$62.7 million. On an organic basis, sales increased 0.9 percent.
- Non-GAAP gross margin increased 130 basis points compared to prior year driven by strong operational performance, structural cost reductions, favorable material costs and price realization, partially offset by lower volume and unfavorable product mix.
- Selling and administrative expenses, as a percentage of sales, were flat to the prior year. Higher freight costs, strategic investments and acquisition impact were offset by lower incentive based compensation and cost reductions.
- The Corporation recorded$17.3 millionof restructuring and impairment charges and transition costs. These costs included goodwill and intangible impairment charges of$11.2 millionrelated to a small office furniture business and$6.1 millionof restructuring and transition costs in connection with previously announced closures, acquisition integration and structural realignment. 2014 included$43.1 millionof restructuring and impairment charges and transition costs.
|
Office Furniture – Financial Performance (Dollars in millions) |
||||||||||||
| Three Months Ended | Twelve Months Ended | |||||||||||
| 1/2/2016 | 1/3/2015 | Change | 1/2/2016 | 1/3/2015 | Change | |||||||
| GAAP | ||||||||||||
| Net Sales | $443.8 | $468.6 | -5.3% | $1,777.8 | $1,739.0 | 2.2% | ||||||
| Operating Profit | $28.3 | $9.6 | 195.5% | $136.6 | $87.1 | 56.9% | ||||||
| Operating Profit % | 6.4% | 2.0% | 440bps | 7.7% | 5.0% | 270bps | ||||||
| Non-GAAP | ||||||||||||
| Operating Profit | $40.9 | $33.1 | 23.4% | $151.6 | $120.8 | 25.5% | ||||||
| Operating Profit % | 9.2% | 7.1% | 210bps | 8.5% | 6.9% | 160bps | ||||||
- Fourth quarter sales decreased$24.8 millionor 5.3 percent to$443.8 million. Sales for the quarter decreased in both our supplies-driven and contract channels.
- Fourth quarter non-GAAP operating profit increased$7.8 millionor 23.4 percent. Strong operational performance, structural cost reductions, favorable material costs and price realization were partially offset by lower volume.
|
Hearth Products – Financial Performance (Dollars in millions) |
||||||||||||
| Three Months Ended | Twelve Months Ended | |||||||||||
| 1/2/2016 | 1/3/2015 | Change | 1/2/2016 | 1/3/2015 | Change | |||||||
| GAAP | ||||||||||||
| Net Sales | $153.1 | $178.0 | -14.0% | $526.6 | $483.6 | 8.9% | ||||||
| Operating Profit | $31.0 | $33.1 | -6.3% | $78.2 | $77.1 | 1.4% | ||||||
| Operating Profit % | 20.3% | 18.6% | 170bps | 14.8% | 15.9% | -110bps | ||||||
| Non-GAAP | ||||||||||||
| Operating Profit | $31.1 | $33.1 | -6.0% | $80.4 | $77.1 | 4.4% | ||||||
| Operating Profit % | 20.3% | 18.6% | 170bps | 15.3% | 15.9% | -60bps | ||||||
- Fourth quarter sales decreased$24.9 millionor 14.0 percent to$153.1 million. Significantly lower biomass sales in the remodel/retrofit channel were partially offset by continued growth in the new construction channel.
- For the quarter, non-GAAP operating profit decreased$2.0 millionor 6.0 percent due to lower volume partially offset by cost reductions, favorable material costs and price realization.
Outlook
"I am pleased with our performance and believe we are competing well. Our markets have slowed and we are aggressively moving to reduce structural costs while continuing to invest for long-term profitable growth. I remain confident in our ability to create long-term shareholder value," said Mr. Askren.
The Corporation estimates sales to be down 3 to 7 percent in the first quarter over the same period in the prior year. Non-GAAP earnings per share are anticipated to be in the range of$0.16 to $0.21for the first quarter and$2.20 to $2.60for the full year, which excludes restructuring and transition costs.
About HNI Corporation
HNI Corporation is a NYSE traded company (ticker symbol: HNI) providing products and solutions for the home and workplace environments. HNI Corporation is a leading global office furniture manufacturer and is the nation's leading manufacturer of hearth products. The Corporation's strong brands have leading positions in their markets. More information can be found on the Corporation's website atwww.hnicorp.com.
|
HNI CORPORATION Unaudited Condensed Consolidated Statement of Operations |
||||||||
|
(Dollars in thousands, except per share data) |
Three Months Ended | Twelve Months Ended | ||||||
| 1/2/2016 | 1/3/2015 | 1/2/2016 | 1/3/2015 | |||||
| Net sales | $596,866 | $646,661 | $2,304,419 | $2,222,695 | ||||
| Cost of products sold | 371,723 | 418,698 | 1,457,021 | 1,438,495 | ||||
| Gross profit | 225,143 | 227,963 | 847,398 | 784,200 | ||||
| Selling and administrative expenses | 165,772 | 182,341 | 672,125 | 649,055 | ||||
| (Gain) loss on sale of assets | (195) | (977) | (195) | (10,723) | ||||
| Restructuring and impairment charges | 11,803 | 21,778 | 11,792 | 33,019 | ||||
| Operating income | 47,763 | 24,821 | 163,676 | 112,849 | ||||
| Interest income | 76 | 92 | 395 | 418 | ||||
| Interest expense | 1,211 | 1,976 | 6,901 | 8,336 | ||||
| Income before income taxes | 46,628 | 22,937 | 157,170 | 104,931 | ||||
| Income taxes | 14,397 | 15,959 | 51,764 | 43,776 | ||||
| Net income | 32,231 | 6,978 | 105,406 | 61,155 | ||||
| Less: Net (loss) attributable to the noncontrolling interest | 0 | (104) | (30) | (316) | ||||
| Net income attributable to HNI Corporation | $32,231 | $7,082 | $105,436 | $61,471 | ||||
| Net income attributable to HNI Corporation common shareholders – basic | $0.73 | $0.16 | $2.38 | $1.37 | ||||
| Average number of common shares outstanding – basic | 44,158,369 | 44,324,249 | 44,285,298 | 44,759,716 | ||||
| Net income attributable to HNI Corporation common shareholders – diluted | $0.71 | $0.16 | $2.32 | $1.35 | ||||
| Average number of common shares outstanding – diluted | 45,199,111 | 45,202,346 | 45,440,653 | 45,578,872 | ||||
| Unaudited Condensed Consolidated Balance Sheet | ||||||||||
| Assets | Liabilities and Shareholders' Equity | |||||||||
| (Dollars in thousands) | As of | As of | ||||||||
| 1/2/2016 | 1/3/2015 | 1/2/2016 | 1/3/2015 | |||||||
| Cash and cash equivalents | $28,548 | $34,144 | Accounts payable and | |||||||
| Short-term investments | 4,252 | 3,052 | accrued expenses | $424,405 | $453,754 | |||||
| Receivables | 243,409 | 240,053 | Note payable and current | |||||||
| Inventories | 125,228 | 121,791 | maturities of long-term debt | 5,477 | 160 | |||||
| Deferred income taxes | 0 | 17,310 | Current maturities of other | |||||||
| Prepaid expenses and | long-term obligations | 6,018 | 3,419 | |||||||
| other current assets | 36,933 | 39,209 | ||||||||
| Current assets | 438,370 | 455,559 | Current liabilities | 435,900 | 457,333 | |||||
| Property and equipment – net | 341,159 | 311,008 | Long-term debt | 185,000 | 197,736 | |||||
| Goodwill | 277,650 | 279,310 | Other long-term liabilities | 76,792 | 80,353 | |||||
| Other assets | 206,746 | 193,457 | Deferred income taxes | 88,934 | 89,411 | |||||
| Parent Company shareholders' | ||||||||||
| equity | 476,954 | 414,587 | ||||||||
| Noncontrolling interest | 345 | (86) | ||||||||
| Shareholders' equity | 477,299 | 414,501 | ||||||||
| Total liabilities and | ||||||||||
| Total assets | $1,263,925 | $1,239,334 | shareholders' equity | $1,263,925 | $1,239,334 | |||||
| Unaudited Condensed Consolidated Statement of Cash Flows | ||||
| Twelve Months Ended | ||||
| (Dollars in thousands) | 1/2/2016 | 1/3/2015 | ||
| Net cash flows from (to) operating activities | $173,352 | $167,796 | ||
| Net cash flows from (to) investing activities: | ||||
| Capital expenditures | (114,966) | (112,713) | ||
| Other | 2,091 | (41,497) | ||
| Net cash flows from (to) financing activities | (66,073) | (44,472) | ||
| Net increase (decrease) in cash and cash equivalents | (5,596) | (30,886) | ||
| Cash and cash equivalents at beginning of period | 34,144 | 65,030 | ||
| Cash and cash equivalents at end of period | $28,548 | $34,144 | ||
| Business Segment Data | ||||||||
| Three Months Ended | Twelve Months Ended | |||||||
| (Dollars in thousands) | 1/2/2016 | 1/3/2015 | 1/2/2016 | 1/3/2015 | ||||
| Net sales: | ||||||||
| Office furniture | $443,791 | $468,645 | $1,777,804 | $1,739,049 | ||||
| Hearth products | 153,075 | 178,016 | 526,615 | 483,646 | ||||
| $596,866 | $646,661 | $2,304,419 | $2,222,695 | |||||
| Operating profit: | ||||||||
| Office furniture | $28,261 | $9,565 | $136,593 | $87,053 | ||||
| Hearth products | 31,001 | 33,092 | 78,162 | 77,066 | ||||
| Total operating profit | 59,262 | 42,657 | 214,755 | 164,119 | ||||
| Unallocated corporate expense | (12,634) | (19,720) | (57,585) | (59,188) | ||||
| Income before income taxes | $46,628 | $22,937 | $157,170 | $104,931 | ||||
| Depreciation and amortization expense: | ||||||||
| Office furniture | $11,131 | $11,493 | $42,415 | $45,891 | ||||
| Hearth products | 2,259 | 1,960 | 8,430 | 5,415 | ||||
| General corporate | 1,875 | 1,505 | 6,719 | 5,416 | ||||
| $15,265 | $14,958 | $57,564 | $56,722 | |||||
| Capital expenditures (including capitalized software): | ||||||||
| Office furniture | $18,861 | $19,318 | $64,850 | $62,696 | ||||
| Hearth products | 3,883 | 1,953 | 11,078 | 6,342 | ||||
| General corporate | 10,649 | 9,694 | 39,038 | 43,675 | ||||
| $33,393 | $30,965 | $114,966 | $112,713 | |||||
| As of | As of | |||||||
| 1/2/2016 | 1/3/2015 | |||||||
| Identifiable assets: | ||||||||
| Office furniture | $739,915 | $724,293 | ||||||
| Hearth products | 341,813 | 341,315 | ||||||
| General corporate | 182,197 | 173,726 | ||||||
| $1,263,925 | $1,239,334 | |||||||
Non-GAAP Financial Measures
This earnings release contains certain non-GAAP financial measures. A "non-GAAP financial measure" is a numerical measure of a company's financial performance that excludes or includes amounts different than the most directly comparable measure calculated and presented in accordance with GAAP in the statements of income, balance sheets or statements of cash flow of the company. We have provided a reconciliation of non-GAAP financial measures to the most directly comparable GAAP financial measure.
The non-GAAP financial measures used within this earnings release are: gross profit, operating income, operating profit, net income per diluted share (i.e., EPS), excluding restructuring and impairment charges, transition costs and (gain)/loss on sale of assets. Non-GAAP EPS is calculated using the Corporation's overall effective tax rate for the period. We present these measures because management uses this information to monitor and evaluate financial results and trends. Management believes this information is also useful for investors. This earnings release also contains a forward-looking estimate of non-GAAP earnings per diluted share for the first quarter and full fiscal year 2016. We provide such non-GAAP measures to investors on a prospective basis for the same reasons we provide them to investors on a historical basis. We are unable to provide a reconciliation of our forward-looking estimate of non-GAAP earnings per diluted share to a forward-looking estimate of GAAP earnings per diluted share because certain information needed to make a reasonable forward-looking estimate of GAAP earnings per diluted share for the first quarter and full fiscal year is difficult to predict and estimate and is often dependent on future events which may be uncertain or outside of our control. These may include unanticipated charges related to asset impairments (fixed assets, intangibles or goodwill), unanticipated acquisition related costs and other unanticipated non-recurring items not reflective of ongoing operations.
|
HNI Corporation Reconciliation (Dollars in millions, except per share data) |
|||||||||||||||||
| Three Months Ended 1/2/2016 | Three Months Ended 1/3/2015 | ||||||||||||||||
| Gross Profit | Operating Income |
EPS |
Gross Profit | Operating Income |
EPS |
||||||||||||
| As reported (GAAP) | $225.1 | $47.8 | $0.71 | $228.0 | $24.8 | $0.16 | |||||||||||
| % of net sales | 37.7% | 8.0% | 35.3% | 3.8% | |||||||||||||
| Restructuring and impairment charges | $0.0 | $11.8 | $0.18 | $0.2 | $22.0 | $0.47 | |||||||||||
| Transition costs | $0.9 | $0.9 | $0.01 | $2.5 | $2.5 | $0.03 | |||||||||||
| (Gain)/loss on sale of assets | — | — | — | — | -$1.0 | -$0.01 | |||||||||||
| Results (non-GAAP) | $226.1 | $60.5 | $0.91 | $230.7 | $48.4 | $0.65 | |||||||||||
| % of net sales | 37.9% | 10.1% | 35.7% | 7.5% | |||||||||||||
|
HNI Corporation Reconciliation (Dollars in millions, except per share data) |
|||||||||||||||||
| Twelve Months Ended 1/2/2016 | Twelve Months Ended 1/3/2015 | ||||||||||||||||
| Gross Profit | Operating Income |
EPS |
Gross Profit | Operating Income |
EPS |
||||||||||||
| As reported (GAAP) | $847.4 | $163.7 | $2.32 | $784.2 | $112.8 | $1.35 | |||||||||||
| % of net sales | 36.8% | 7.1% | 35.3% | 5.1% | |||||||||||||
| Restructuring and impairment charges | $0.8 | $12.6 | $0.19 | $5.2 | $38.2 | $0.70 | |||||||||||
| Transition costs | $4.7 | $4.7 | $0.07 | $4.9 | $4.9 | $0.07 | |||||||||||
| (Gain)/loss on sale of assets | — | — | — | — | -$10.7 | -$0.15 | |||||||||||
| Results (non-GAAP) | $852.9 | $180.9 | $2.58 | $794.3 | $145.3 | $1.97 | |||||||||||
| % of net sales | 37.0% | 7.9% | 35.7% | 6.5% | |||||||||||||
|
Office Furniture Reconciliation (Dollars in millions) |
|||||||||||||||||
| Three Months Ended |
Percent Change |
Twelve Months Ended |
Percent Change |
||||||||||||||
| 1/2/2016 | 1/3/2015 | 1/2/2016 | 1/3/2015 | ||||||||||||||
| Operating profit as reported (GAAP) | $28.3 | $9.6 | 195.5% | $136.6 | $87.1 | 56.9% | |||||||||||
| % of net sales | 6.4% | 2.0% | 7.7% | 5.0% | |||||||||||||
| Restructuring and impairment charges | $11.8 | $22.0 | $11.6 | $38.2 | |||||||||||||
| Transition costs | $0.8 | $2.5 | $3.3 | $4.9 | |||||||||||||
| (Gain)/loss on sale of assets | — | -$1.0 | — | -$9.4 | |||||||||||||
| Operating profit (non-GAAP) | $40.9 | $33.1 | 23.4% | $151.6 | $120.8 | 25.5% | |||||||||||
| % of net sales | 9.2% | 7.1% | 8.5% | 6.9% | |||||||||||||
|
Hearth Reconciliation (Dollars in millions) |
|||||||||||||||||
| Three Months Ended |
Percent Change |
Twelve Months Ended |
Percent Change |
||||||||||||||
| 1/2/2016 | 1/3/2015 | 1/2/2016 | 1/3/2015 | ||||||||||||||
| Operating profit as reported (GAAP) | $31.0 | $33.1 | -6.3% | $78.2 | $77.1 | 1.4% | |||||||||||
| % of net sales | 20.2% | 18.6% | 14.8% | 15.9% | |||||||||||||
| Restructuring charges | $0.0 | — | $0.9 | — | |||||||||||||
| Transition costs | $0.1 | — | $1.4 | — | |||||||||||||
| Operating profit (non-GAAP) | $31.1 | $33.1 | -5.9% | $80.4 | $77.1 | 4.4% | |||||||||||
| % of net sales | 20.3% | 18.6% | 15.3% | 15.9% | |||||||||||||
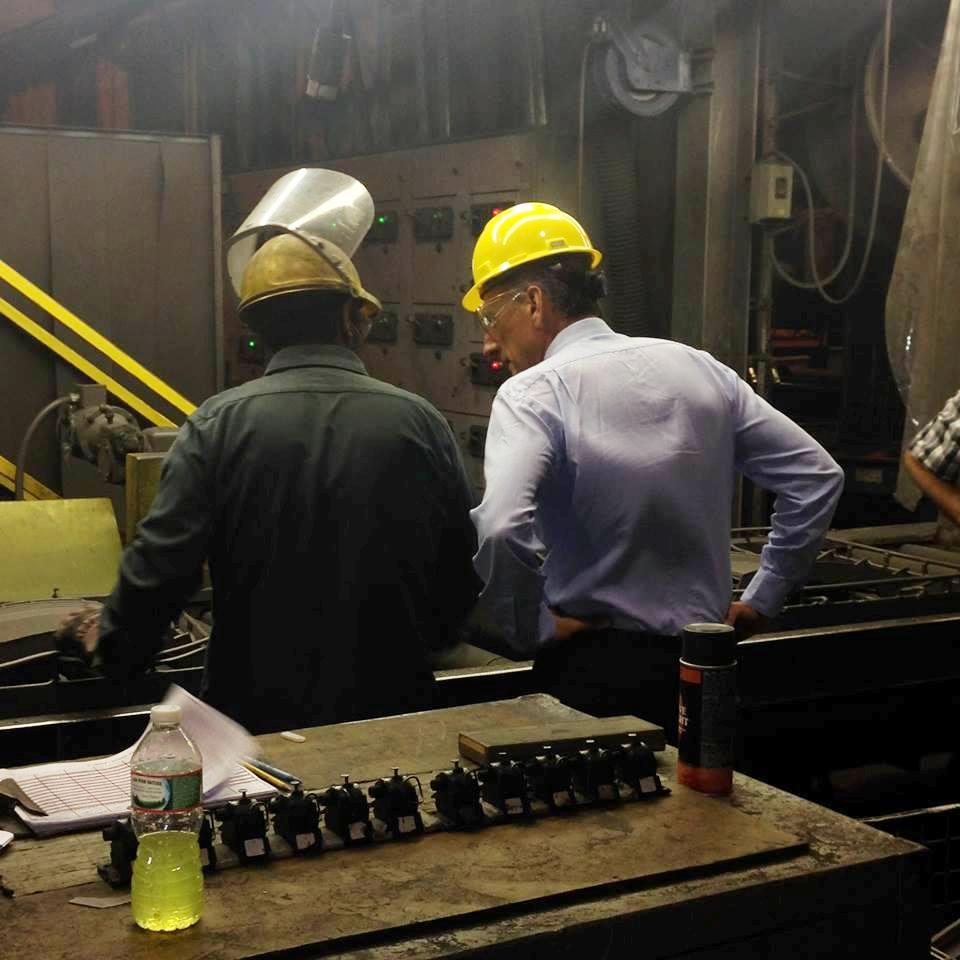
SOURCE MUSCATINE, Iowa, Feb.10, 2016 /PRNewswire/ --HNI Corporation. Photo:Governor Shumlin at the Randolph foundry summer 2014.