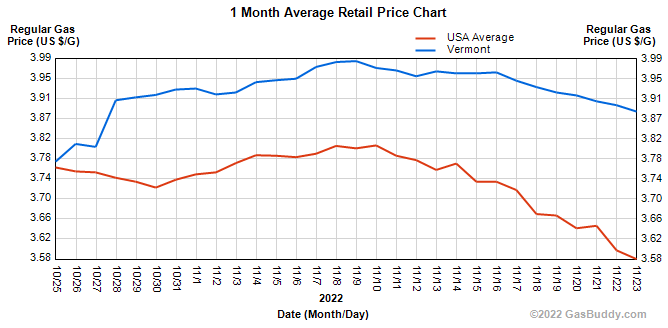
Vermont Business Magazine Average gasoline prices in Vermont fell a surprising 8 cents in the last week to $3.88 per gallon. Prices are down 12 cents lower than last month, but are 45 cents higher than a year ago. The Vermont price is 30 cents higher than the national average.
In addition, average gasoline prices in Burlington have fallen 3.5 cents per gallon in the last week, averaging $3.93/g today, according to GasBuddy's survey of 100 stations in Burlington. Prices in Burlington are 7.1 cents per gallon higher than a month ago and stand 46.7 cents per gallon higher than a year ago. The national average price of diesel has declined 6.7 cents in the last week and stands at $5.28 per gallon.
Statistics
| Vermont | USA | Trend | |
|---|---|---|---|
| Today | 3.880 | 3.581 |  |
| Yesterday | 3.895 | 3.599 | |
| One Week Ago | 3.962 | 3.739 | |
| One Month Ago | 3.765 | 3.774 | |
| One Year Ago | 3.439 | 3.416 | |
| * Average Regular Gas Prices - Updated: 11.23.2022. 3:55 PM | |||
According to GasBuddy price reports, the cheapest station in Burlington was priced at $3.69/g yesterday while the most expensive was $3.99/g, a difference of 30.0 cents per gallon. The lowest price in the state yesterday was $3.50/g while the highest was $4.09/g, a difference of 59.0 cents per gallon.
The national average price of gasoline has fallen 15 cents per gallon in the last week, averaging $3.58/g. The national average is down 19 cents per gallon from a month ago and stands 17 cents per gallon higher than a year ago, according to GasBuddy data compiled from more than 11 million weekly price reports covering over 150,000 gas stations across the country.
Historical gasoline prices in Burlington and the national average going back ten years:
November 21, 2021: $3.46/g (U.S. Average: $3.39/g)
November 21, 2020: $2.11/g (U.S. Average: $2.11/g)
November 21, 2019: $2.69/g (U.S. Average: $2.60/g)
November 21, 2018: $2.84/g (U.S. Average: $2.58/g)
November 21, 2017: $2.59/g (U.S. Average: $2.52/g)
November 21, 2016: $2.27/g (U.S. Average: $2.13/g)
November 21, 2015: $2.22/g (U.S. Average: $2.08/g)
November 21, 2014: $3.17/g (U.S. Average: $2.83/g)
November 21, 2013: $3.45/g (U.S. Average: $3.21/g)
November 21, 2012: $3.74/g (U.S. Average: $3.42/g)
Neighboring areas and their current gas prices:
Albany- $3.92/g, down 6.2 cents per gallon from last week's $3.98/g.
New Hampshire- $3.70/g, down 7.8 cents per gallon from last week's $3.78/g.
"What an incredible turnaround in the last week. While a decline was expected in more states than last week, I didn't expect every single state to hop on the bandwagon so quickly. But, it's terrific news as motorists prepare for Thanksgiving travel, with tens of thousands of stations under $3 per gallon, and thousands more to join in the next few weeks, barring a dramatic turnaround," said Patrick De Haan, head of petroleum analysis at GasBuddy. "Everyone will be seeing relief at the pump this week, with even more substantial declines on the way as oil prices plummeted last week to briefly trade under $80 per barrel. It's not impossible that if oil markets hold here, we could see a national average of $2.99 around Christmas, certainly the gift that every motorist is hoping for. Drivers shouldn't be in a rush to fill up as prices will come down nearly coast-to-coast into the heavily traveled Thanksgiving holiday."
GasBuddy is the authoritative voice for gas prices and the only source for station-level data. GasBuddy's survey updates 288 times every day from the most diverse list of sources covering nearly 150,000 stations nationwide, the most comprehensive and up-to-date in the country. GasBuddy data is accessible at http://prices.GasBuddy.com.
SOURCE GasBuddy