by Timothy McQuiston, Vermont Business Magazine Today, the Vermont Department of Labor reported that the February 2022 unemployment rate fell one-tenth to 2.9 percent. As with the national numbers, all three major metrics improved, as the labor force and employment increased and the jobless number decreased. The US weekly jobless claims fell to a 53-year low. Vermont's weekly claims are at their lowest point so far this year.
The overall US unemployment rate in February was 3.8 percent, which was a decrease of two-tenths of one percentage point from the revised January estimate. The rates are based on household data gathered by the Census Bureau. Vermont has the 11th lowest unemployment rate in the nation (see chart below). Vermont had been among the lowest five by the end of last year, until the annual numbers were revised and the labor force figures increased.
Nebraska and Utah are tied at 2.1 percent. New Mexico is highest at 5.6 percent. New Hampshire (2.7 percent) is the only state with a lower rate than Vermont in the East.
Vermont Labor Commissioner Michael Harrington said: “Over the past 12 months, the Vermont economy has added over 10,000 jobs. This growth is found in the private sector as Vermont businesses are actively adding employment. The bulk of this increase can be attributed to recovery efforts in the Leisure & Hospitality industry which was disproportionately impacted by COVID-19. The second largest increase over the past year is found in the Professional & Business Services sector.
“According to an alternate data series that lags the monthly data released today, this sector has seen tremendous growth in employment, number of establishments, and wages. This sector is poised for sustained growth as individuals and employers continue to specialize in occupations such as bookkeeping, HR, cybersecurity, management consulting and others, either as an advancing employee or a new business venture.
“As Vermont’s employers continue to grow their business and expand operations, more opportunities for jobseekers are becoming available. There has never been a better time to be looking for a job, and our Workforce Development team can help provide a variety of resources and support. As a first step for individuals and employers, I encourage you to visit VermontJobLink.com and create an account to post a job, search, and apply for jobs. To connect with a job specialist or business services staff person, please call 833-719-1051 or visit Labor.Vermont.gov/Jobs.”
State of Vermont Overview
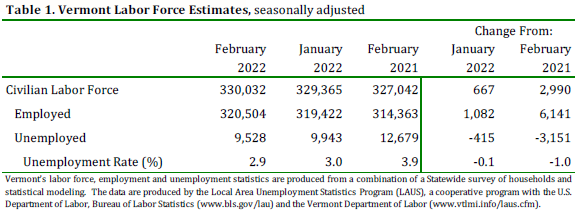
The seasonally-adjusted Vermont data for February show the Vermont civilian labor force increased by 667 from the prior month’s revised estimate (see Table 1). The number of employed persons increased by 1,082 and the number of unemployed persons decreased by 415.
The changes to the number of employed persons and the unemployment rate were statistically significant in the seasonally-adjusted series.
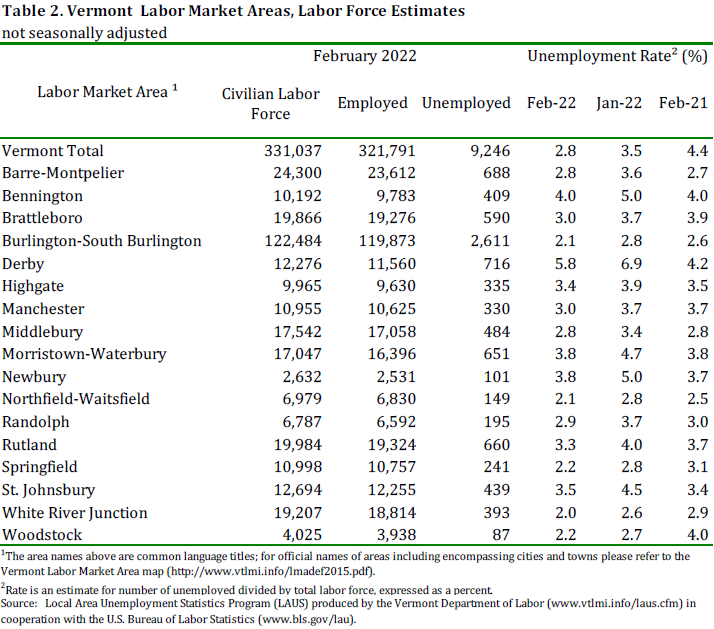
The February unemployment rates for Vermont’s 17 labor market areas ranged from 2.0 percent in White River Junction to 5.8 percent in Derby (note: local labor market area unemployment rates are not seasonally-adjusted – see Table 2).
For comparison, the February unadjusted unemployment rate for Vermont was 2.8 percent, which was a decrease of seven-tenths of one percentage point from the revised unadjusted January level and a decrease of one and six-tenths of one percentage point from a year ago.
Analysis of Job Changes by Industry
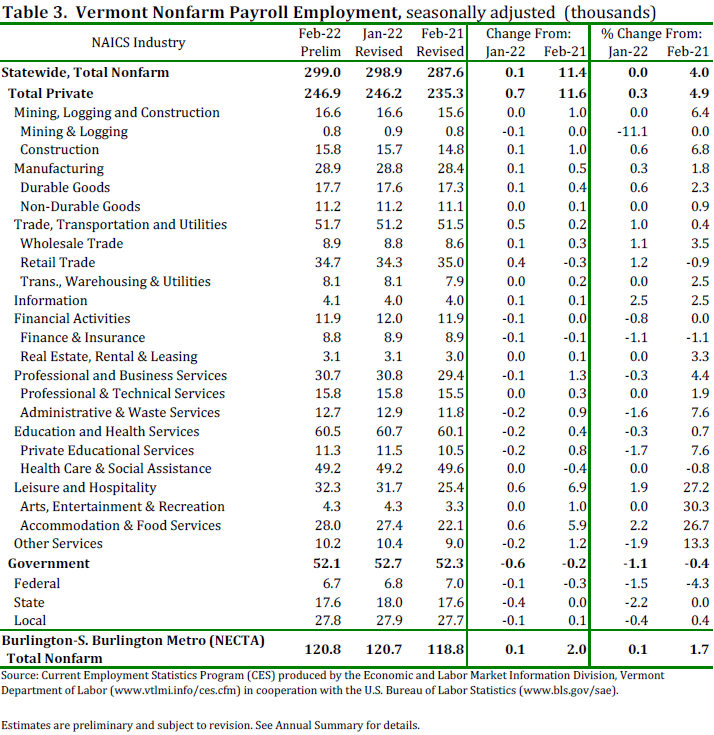
Seasonally-Adjusted (Table 3)
The seasonally-adjusted data for February reports an increase of 100 jobs from the revised January data. There was an increase of 700 jobs between the preliminary and the revised January estimates due to the inclusion of more data.
The seasonally-adjusted over-the-month changes in February were varied at the industry level.
Those with a notable increase include: Accommodations & Food Services (+600 jobs or +2.2%) and Retail Trade (+400 jobs or +1.2%). Industries with a notable decrease include: State Government (-400 jobs or -2.2%) and Other Services (-200 jobs or -1.9%).
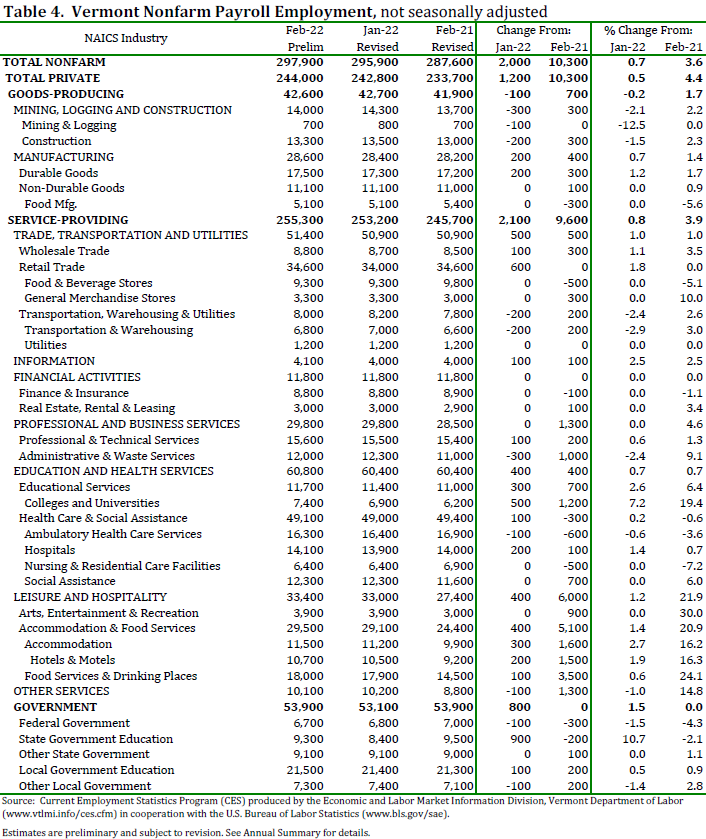
Not-Seasonally-Adjusted (Table 4)
The preliminary ‘not-seasonally-adjusted’ jobs estimates for February shows an increase of 2,000 jobs when compared to the revised January numbers.
As with the ‘seasonally-adjusted’ data, this over-the-month change is from the revised January numbers which experienced an increase of 1,000 jobs from the preliminary estimates.
The broader economic picture can be seen by focusing on the over-the-year changes in this data series.
As detailed in the preliminary ‘not-seasonally-adjusted’ February data, Total Private industries increased by 10,300 jobs (+4.4%) over the year and Government (including public education) employment is at the same level as February 2021.
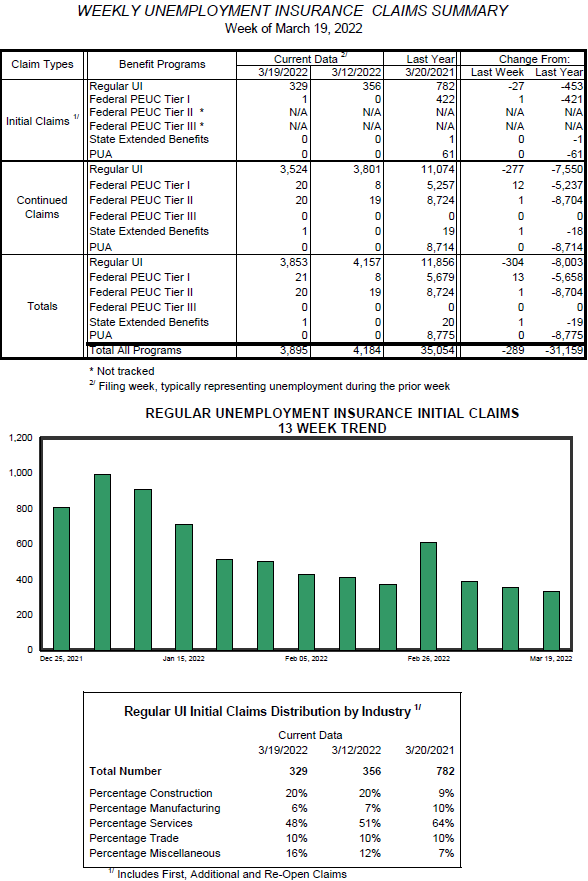
Weekly Claims (Table Below)
Initial weekly unemployment claims fell by 27 to 329 (453 fewer than one year ago) to their lowest number since before the holiday season last November.
Total claims were 3,895, down 289 for the week and down 31,159 from this time last year.
While this steep drop is due in part to more economic activity and job growth, for the most part the decrease resulted from the expiration last September of the federal Pandemic Emergency Unemployment Compensation (PEUC) programs, like the PUA.
__________________________________________________________________________________________________________________
The Unemployment and Jobs Report for March is scheduled to be released on Friday, April 15th, 2022 at 10:00 a.m.
| State | February 2022(P) rate |
Rank |
|---|---|---|
|
Nebraska |
2.1 | 1 |
|
Utah |
2.1 | 1 |
|
Indiana |
2.3 | 3 |
|
Kansas |
2.5 | 4 |
|
Montana |
2.6 | 5 |
|
Oklahoma |
2.6 | 5 |
|
South Dakota |
2.6 | 5 |
|
Minnesota |
2.7 | 8 |
|
New Hampshire |
2.7 | 8 |
|
Idaho |
2.8 | 10 |
|
North Dakota |
2.9 | 11 |
|
Vermont |
2.9 | 11 |
|
Wisconsin |
2.9 | 11 |
|
Alabama |
3.0 | 14 |
|
Arkansas |
3.1 | 15 |
|
Georgia |
3.2 | 16 |
|
Virginia |
3.2 | 16 |
|
Florida |
3.3 | 18 |
|
Tennessee |
3.4 | 19 |
|
Iowa |
3.5 | 20 |
|
South Carolina |
3.5 | 20 |
|
Arizona |
3.6 | 22 |
|
Missouri |
3.7 | 23 |
|
North Carolina |
3.7 | 23 |
|
Wyoming |
3.7 | 23 |
|
Rhode Island |
3.9 | 26 |
|
West Virginia |
3.9 | 26 |
|
Colorado |
4.0 | 28 |
|
Maine |
4.0 | 28 |
|
Oregon |
4.0 | 28 |
|
Kentucky |
4.2 | 31 |
|
Ohio |
4.2 | 31 |
|
Hawaii |
4.3 | 33 |
|
Louisiana |
4.3 | 33 |
|
Washington |
4.3 | 33 |
|
Mississippi |
4.5 | 36 |
|
Delaware |
4.6 | 37 |
|
New Jersey |
4.6 | 37 |
|
Massachusetts |
4.7 | 39 |
|
Michigan |
4.7 | 39 |
|
Texas |
4.7 | 39 |
|
Illinois |
4.8 | 42 |
|
Connecticut |
4.9 | 43 |
|
New York |
4.9 | 43 |
|
Maryland |
5.0 | 45 |
|
Nevada |
5.1 | 46 |
|
Pennsylvania |
5.1 | 46 |
|
Alaska |
5.4 | 48 |
|
California |
5.4 | 48 |
|
New Mexico |
5.6 | 50 |
|
District of Columbia |
6.1 | 51 |
|
Footnotes |
||
|
Note: Rates shown are a percentage of the labor force. Data refer to place of residence. Estimates for the current month are subject to revision the following month. |
||
![]()