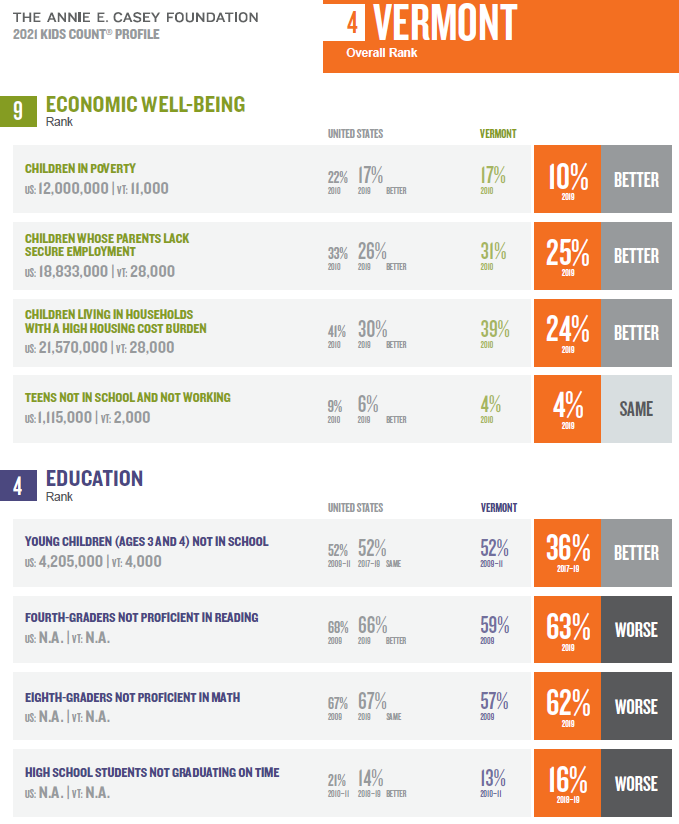
Vermont Business Magazine Vermont again is ranked highly in the annual, national ranking in the well-being of children, finishing Fourth overall. Vermont also did well in the sub-categories for health, education, family and financial. Massachusetts (First) and New Hampshire (Second) also ranked highly in the study. However, within many of the categories, Vermont did the same or worse than in the previous report.
The 32nd edition of the Annie E. Casey Foundation's KIDS COUNT Data Book describes how children across the United States were faring before — and during — the coronavirus pandemic.
This year’s publication continues to deliver the Foundation’s annual state rankings and the latest available data on child well-being. It identifies multiyear trends — comparing statistics from 2010 to 2019. In addition, the report shares data on how families endured throughout the pandemic.
How Kids and Families Have Weathered the Pandemic
Every child needs food, health care and safe and stable housing. Millions of households with children already lacked these necessities before the pandemic, and this economic and public health catastrophe brought millions more face-to-face with challenges ranging from lost health insurance and bare pantries to the threat of homelessness due to eviction or foreclosure.
An additional area of concern: Students are completing a second academic year disrupted by COVID-19, undermining academic performance and altering post-high school plans.
Recommendations for Recovery
The nation will not recover from this crisis without innovative public policy. Several of the Foundation’s federal policy recommendations have already been enacted through the 2020 CARES Act and with 2021's American Rescue Plan. Of particular note is the historic expansion of the federal child tax credit, which is expected to cut the child poverty rate by more than half. Unfortunately, the expansion is currently slated for only one year.
To continue progress already made on recovery, the Foundation recommends: making the expansion of the federal child tax credit permanent; strengthening state and local policies affecting kids and families; and prioritizing racial and ethnic equity in policymaking.
State Rankings
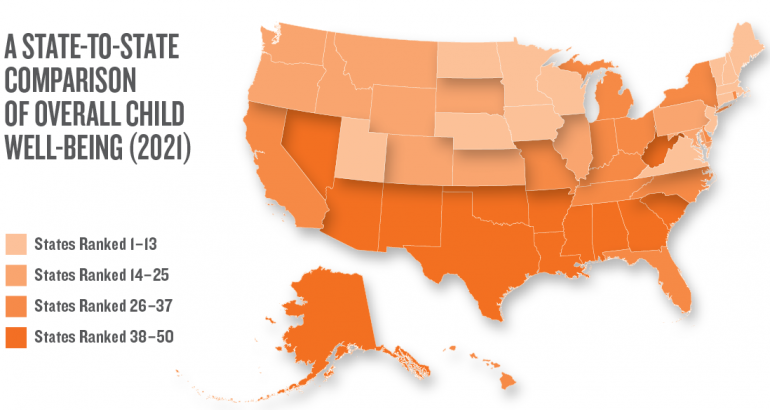
This year, New England states hold two of the top three spots for overall child well-being. Massachusetts ranks first, followed by New Hampshire and Minnesota. Louisiana (48th), Mississippi (49th) and New Mexico (50th) are the three lowest-ranked states.
States in Appalachia, as well as the Southeast and Southwest — where families have the lowest levels of household income — populate the bottom of the overall rankings. In fact, except for Alaska, the 17 lowest-ranked states are in these regions.
Racial Inequities in Child Well-Being
Despite gains for children of all races and income levels during the reporting period, the nation’s racial inequities remain deep, systemic and stubbornly persistent. Data suggest that we as a nation fail to provide children of color with the opportunities and support they need to thrive. States are failing to dismantle barriers that African American, American Indian and Latino children especially encounter. As a result, nearly all index measures show that children experience disparate outcomes in spite of their potential.
In 14 states, the District of Columbia and Puerto Rico, kids of color were the majority of the child population in 2019. The future success of our nation depends on our ability to ensure all children have the chance to be successful.
Trends and Overall Child Well-Being
The Foundation derives a composite index of overall child well-being for each state by combining data across four domains: (1) Economic Well-Being, (2) Education, (3) Health and (4) Family and Community. These composite scores are then translated into a state ranking for child well-being. Explore overall child well-being on the interactive KIDS COUNT Data Book.
Massachusetts Ranks First Again
New England states hold the top two spots for overall child well-being. Massachusetts ranks first, followed by New Hampshire and Minnesota. Louisiana (at 48th place), New Mexico (49th) and Mississippi (50th) are the three lowest-ranked states.
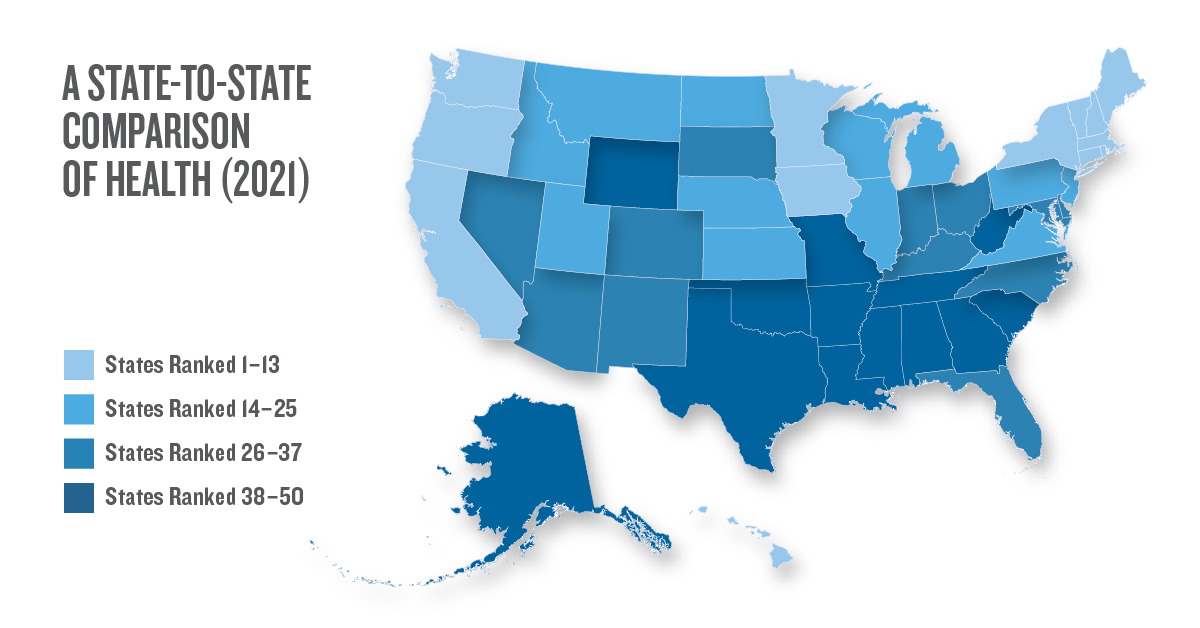
A State-to-State Comparison
Five of the top 10 states in terms of overall child well-being are in the Northeast, including Vermont (fourth), New Jersey (sixth) and Connecticut (eighth). States rounding out the top 10 are Utah (fifth), Nebraska (seventh), Iowa (ninth) and Wisconsin (10th).
District of Columbia and Puerto Rico
Although they are not ranked against states, children in the District of Columbia and Puerto Rico experienced some of the worst outcomes on many of the indicators the Foundation tracks.
Appalachia and the South
States in Appalachia, as well as the Southeast and Southwest — where families have the lowest levels of household income — populate the bottom of the overall rankings. In fact, except for Alaska, the 17 lowest-ranked states are in these regions.
Economic Well-Being
To help children grow into prepared, productive adults, parents need jobs with family-sustaining pay, affordable housing and the ability to invest in their children’s future. Explore economic well-being data on the interactive KIDS COUNT Data Book.
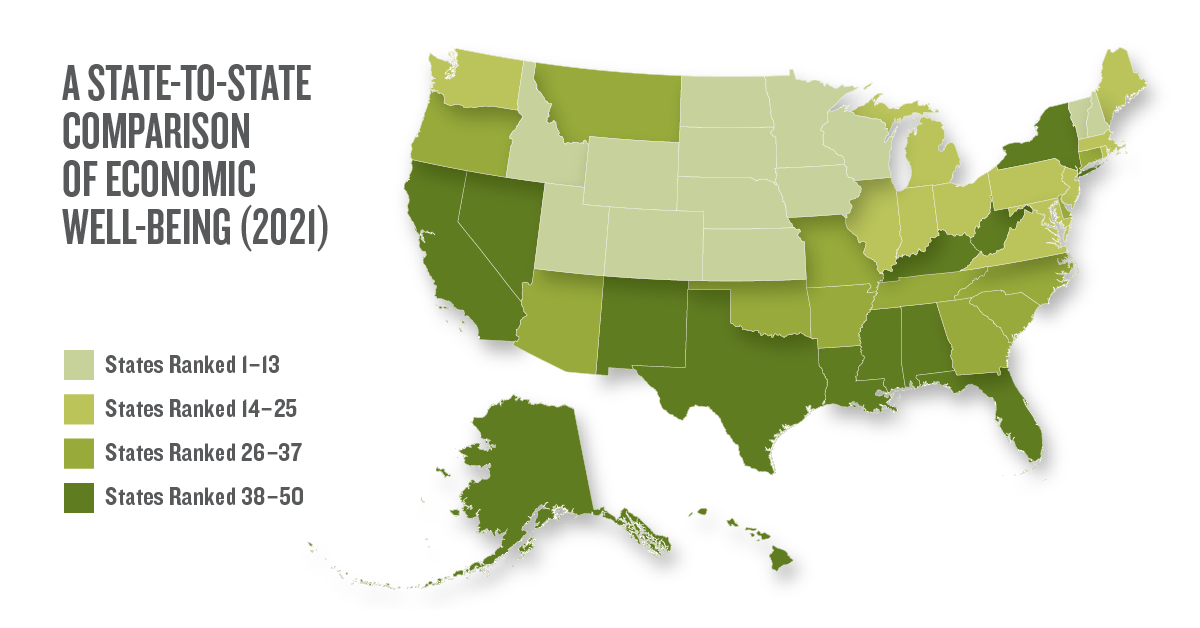
A State-to-State Comparison
In the Economic Well-Being domain, North Dakota ranks first, followed by Nebraska and Minnesota. New Mexico (48th), Louisiana (49th) and Mississippi (50th) are the three lowest-ranked states.
Poverty Is a Threat
Growing up in poverty is one of the greatest threats to healthy child development. It increases the likelihood that a child will be exposed to factors that can impair brain development and lead to poor academic, cognitive and health outcomes. It also can result in higher rates of risky health-related behaviors among adolescents.
The official poverty level in 2019 was $25,926 for a family of two adults and two children.
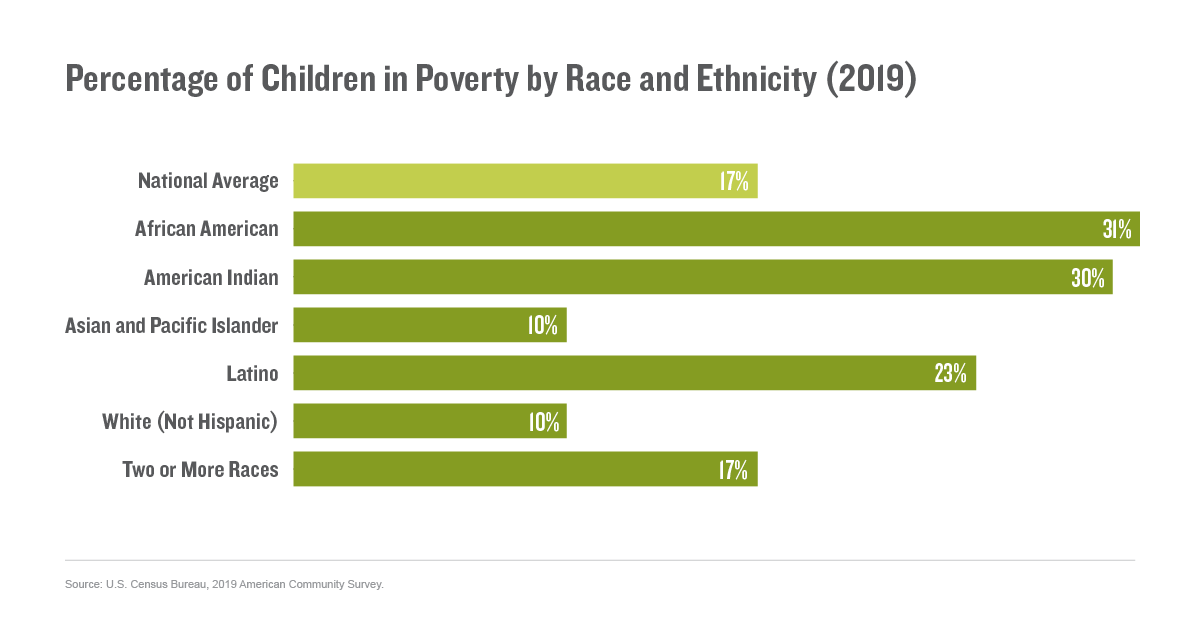
American Indian, Black and Latino Kids More Likely to Live in Poverty
Nationally, 17% of children (12 million) lived in families with incomes below the poverty line in 2019.
The poverty rate among African American and American Indian children (31% and 30%, respectively) was three times the rate for white and Asian and Pacific Islander children (10% for both) in 2019. The poverty rate for Latino kids (23%) was also high.
Benefits of Secure Employment
Secure employment is a key contributor to the financial stability and well-being of families. Employment insecurity and the accompanying income loss can disrupt daily living and relationships and limit families’ access to resources to invest in their children’s development, which can, in turn, diminish children’s achievement in school and chances of future success.
In 2019, more than one in four children (18.8 million) lived in families where no parent had full-time, year-round employment.
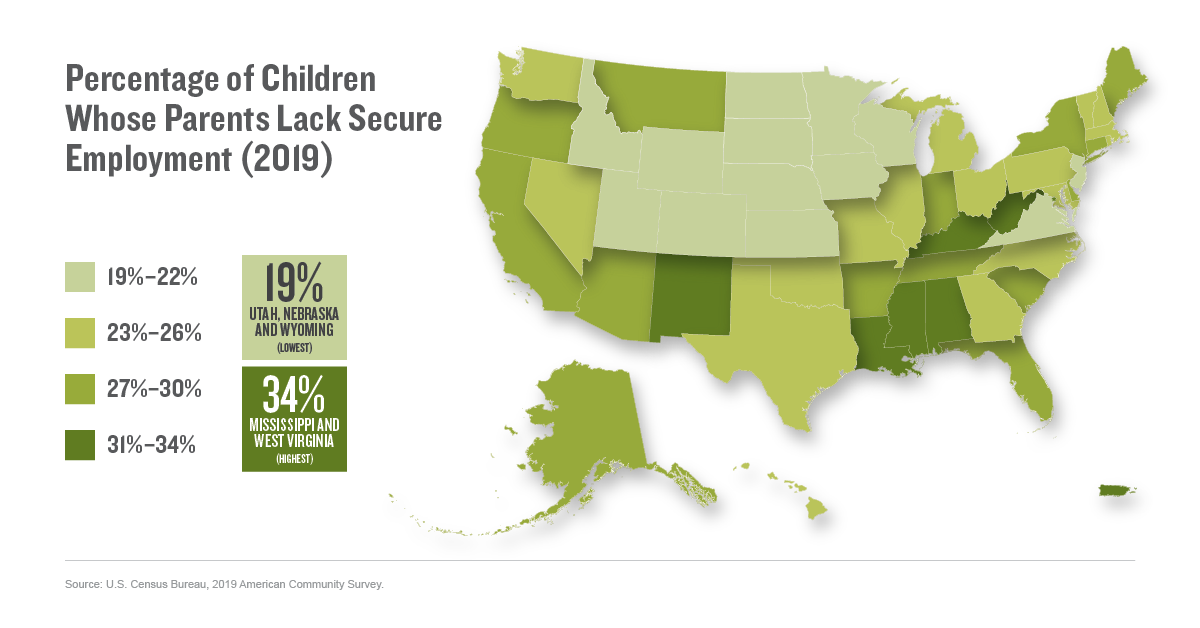
Parents in the South More Likely to Lack Job Stability
At 19%, Nebraska, Utah and Wyoming had the lowest percentage of children in families without secure parental employment in 2019. Mississippi and West Virginia had the highest rate (34%). The share was even greater in Puerto Rico (52%).
The Housing Squeeze
Housing is typically one of the largest family expenses. High housing costs weigh more heavily on low-income families, which are more likely to struggle with finding affordable housing, often spending more than 30% of pretax income on a home, whether they rent or own. Paying too much for housing limits the resources families have for other necessities.
Disconnection Rates Differ by Race
American Indian (11%), African American (10%) and Latino (8%) teens had considerably higher rates of neither being in school nor working than their white (5%) and Asian and Pacific Islander (3%) counterparts.
Education
The early years of children’s lives set the foundation for their lifelong success. Closing significant academic achievement gaps is vital to ensuring that the nation’s future workforce can continue to compete on a global scale. Explore education data on the interactive KIDS COUNT Data Book.
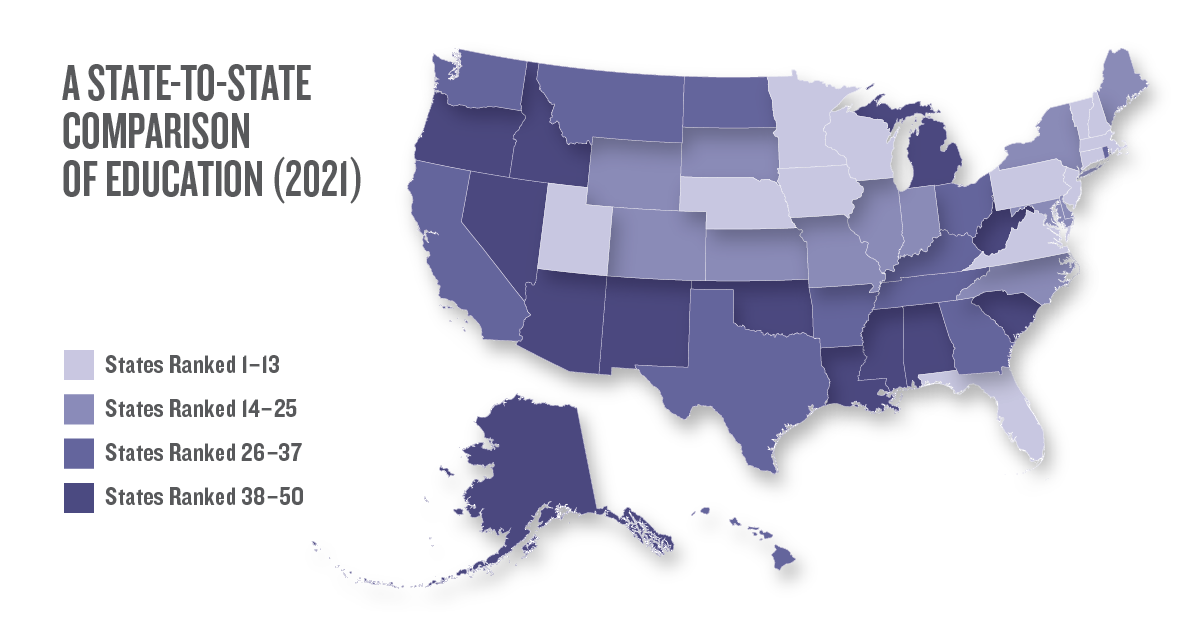
A State-to-State Comparison
In the Education domain, New Jersey ranks first again, followed by Massachusetts and Connecticut. Louisiana (48th), Alaska (49th) and New Mexico (50th) are the three lowest-ranked states.
Many Kids Missing a Strong Academic Start
High-quality preschool programs for 3- to 4-year-olds help set the stage for future skill development, well-being and learning, particularly for those from low-income households.
During 2017–19, 4.2 million kids ages 3–4 were not in school, representing more than half (52%) of all children in that age group. The rate of participation has remained unchanged since 2009–11.
Preschool Participation Rates
In 2017–19, Connecticut had the lowest share of 3- and 4-year-olds not in school, at 34%. The state with the highest percentages of young children not in school in 2017–19 was North Dakota (68%). Although the District of Columbia is not ranked among states, it had the best rate, at 21% — a result of the city’s free, universal preschool for 3- and 4-year-olds.
Roughly half of white and multiracial 3- and 4-year-olds were not in any school programs; the percentage was slightly lower for African American (48%) and Asian and Pacific Islander kids (45%). The rates were noticeably higher for Latino (58%) and American Indian (55%) children.
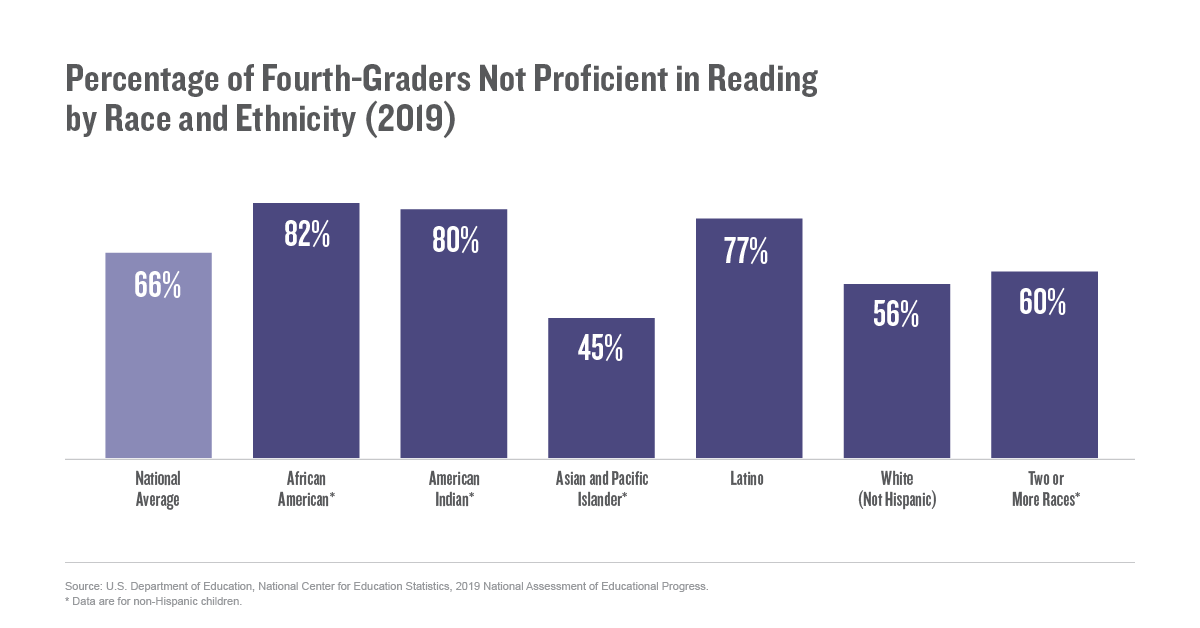
Most Fourth-Graders Not Proficient Readers as Disparities Persist
Sixty-six percent of fourth-graders in public school were reading without proficiency in 2019, an alarming rate though slightly improved from 2009, when 68% scored not proficient.
In 2019, 82% of African American, 80% of American Indian, 77% of Latino and 60% of multiracial fourth-graders were not proficient in reading, compared with 56% of white and 45% of Asian and Pacific Islander students.
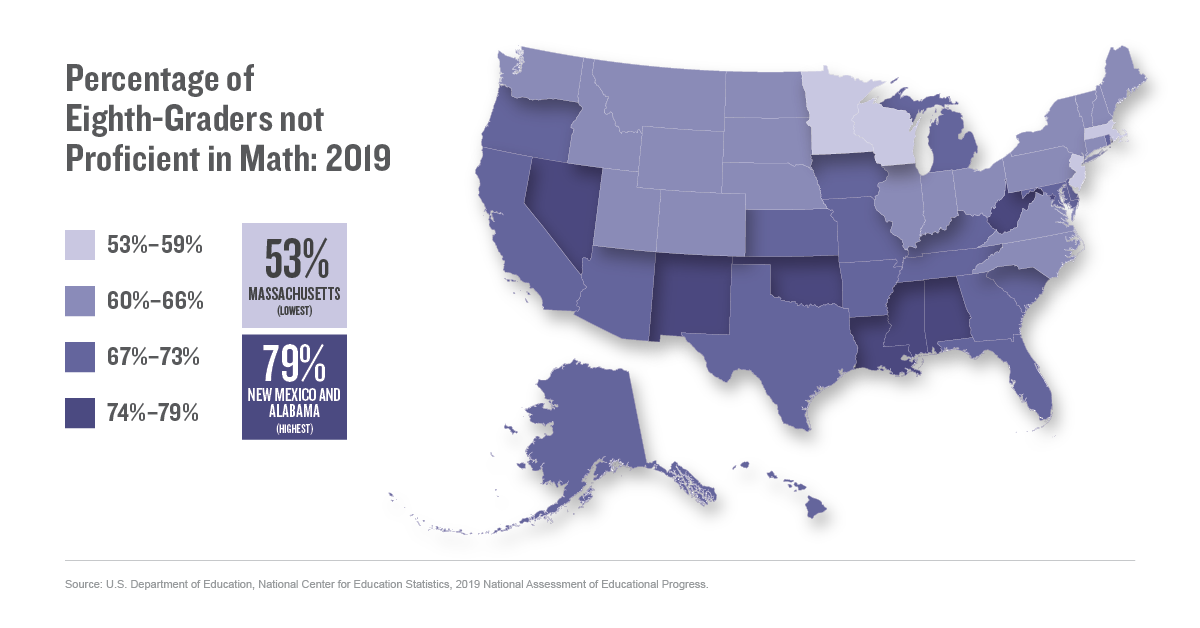
Alabama and New Mexico Earn Low Math Scores
Nationwide, two-thirds (67%) of public school eighth-graders were not proficient in math in 2019. This rate was the same in 2009.
At 53%, Massachusetts students performed best in math, with the lowest percentage of eighth-graders not proficient in 2019. Alabama and New Mexico had highest rate of nonproficient math students, at 79%.
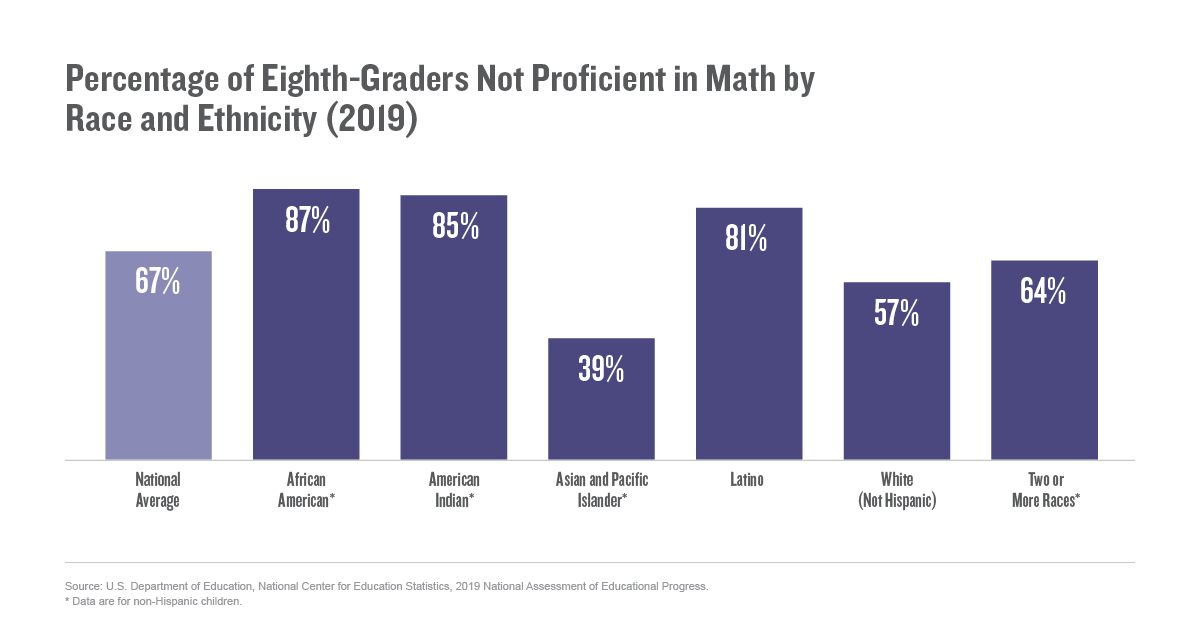
Eighth-Grade Math Proficiency Rates by Race
In 2019, 39% of Asian and Pacific Islander and 57% of white eighth-graders scored below proficiency, compared with 87% of African American, 85% of American Indian and 81% of Latino eighth-graders.
Eighth-grade math achievement improved for African American, Asian and Pacific Islander, Latino and multiracial students between 2009 and 2019 but remained the same for white students while worsening significantly for American Indian children.
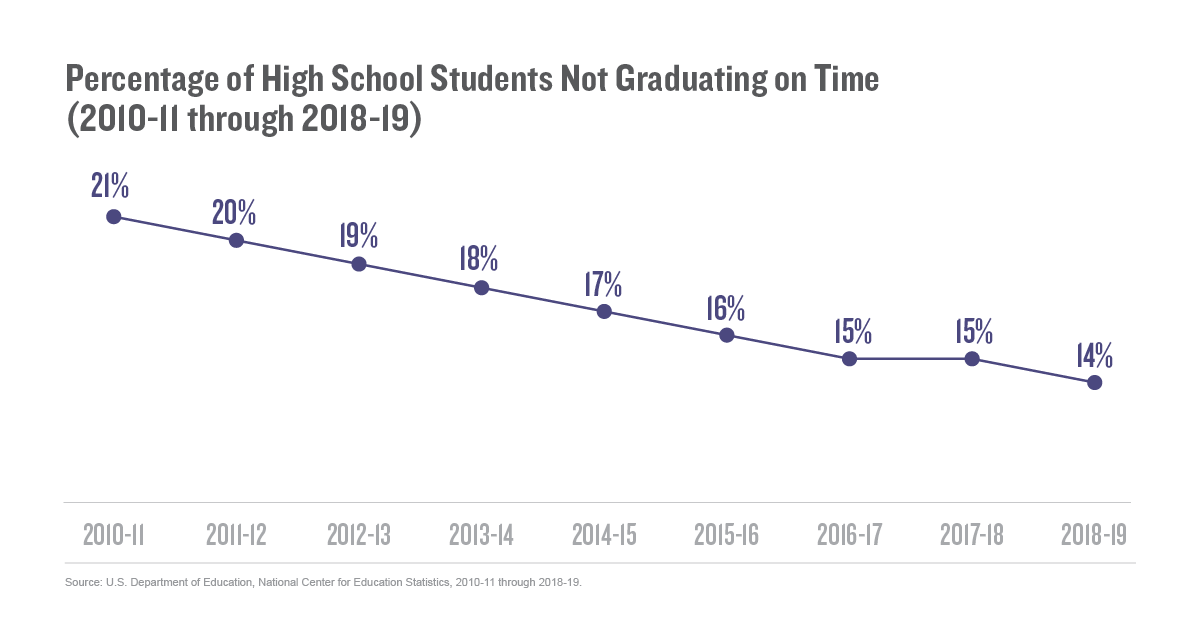
Rate of Youth Failing to Graduate Still Dropping
A high school diploma is critical for entering today’s workforce.
For this indicator, steady improvements have occurred since 2010–11, when 21% of high school students failed to graduate in four years. Nationally, about one in seven (14%) did not graduate on time in the 2018–19 school year, an all-time low.
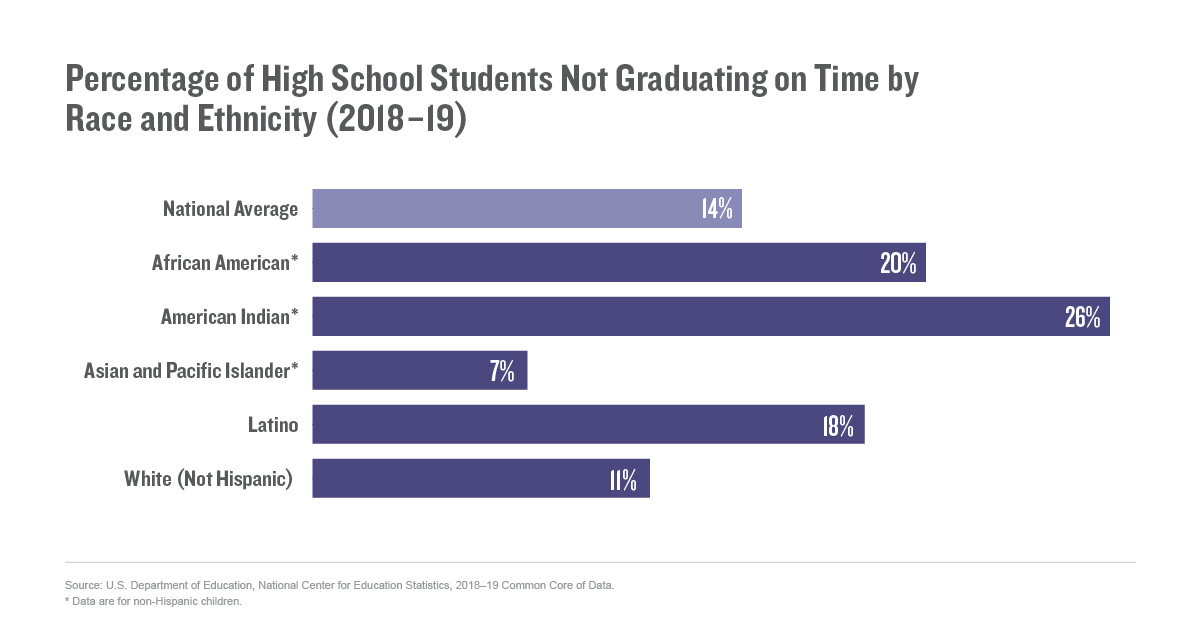
White and Asian Students Most Likely to Graduate on Time
In 2018–19, 11% of white students did not graduate from high school on time. The rates for American Indian and African American students were at least twice as high, at 26% and 20%, respectively. The rate for Latino students was 18%.
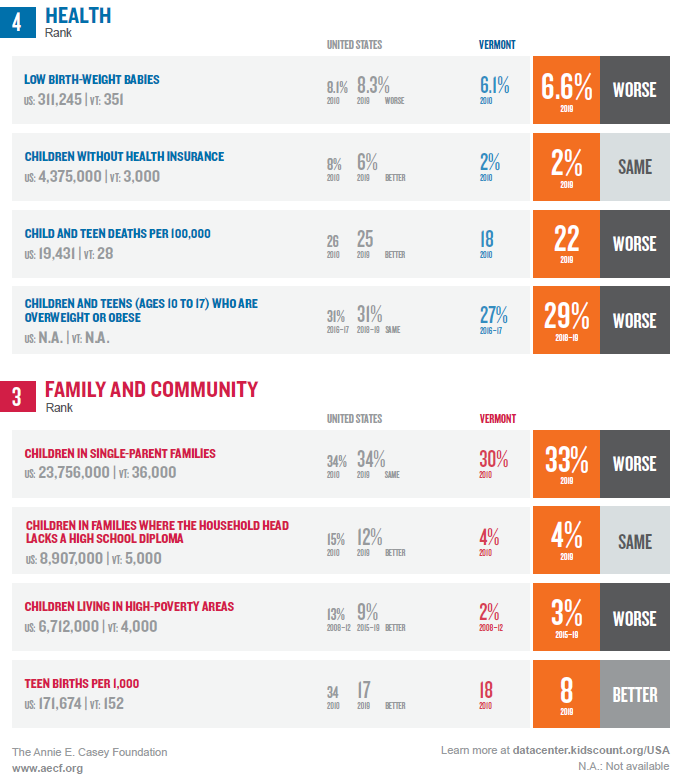
Health
Good health is central to a child’s overall development, and ensuring that kids are born healthy is an important first step toward lifelong success. Explore health data on the interactive KIDS COUNT Data Book.
A State-to-State Comparison
In the Health domain, Massachusetts ranks first, followed by Minnesota and New Hampshire. Louisiana (48th), Texas (49th) and Mississippi (50th) are the three lowest-ranked states.
Why Birth Weight Matters
Birth weight is an important indicator of an infant’s health. Babies born at a low birth weight (less than 5.5 pounds) have a high probability of experiencing developmental problems and short- and long-term disabilities. They also are at greater risk of dying within the first year of life.
Alaska had the lowest percentage of low birth-weight babies in 2019 — 6.3% of live births — while Mississippi had the highest, at 12.3%.
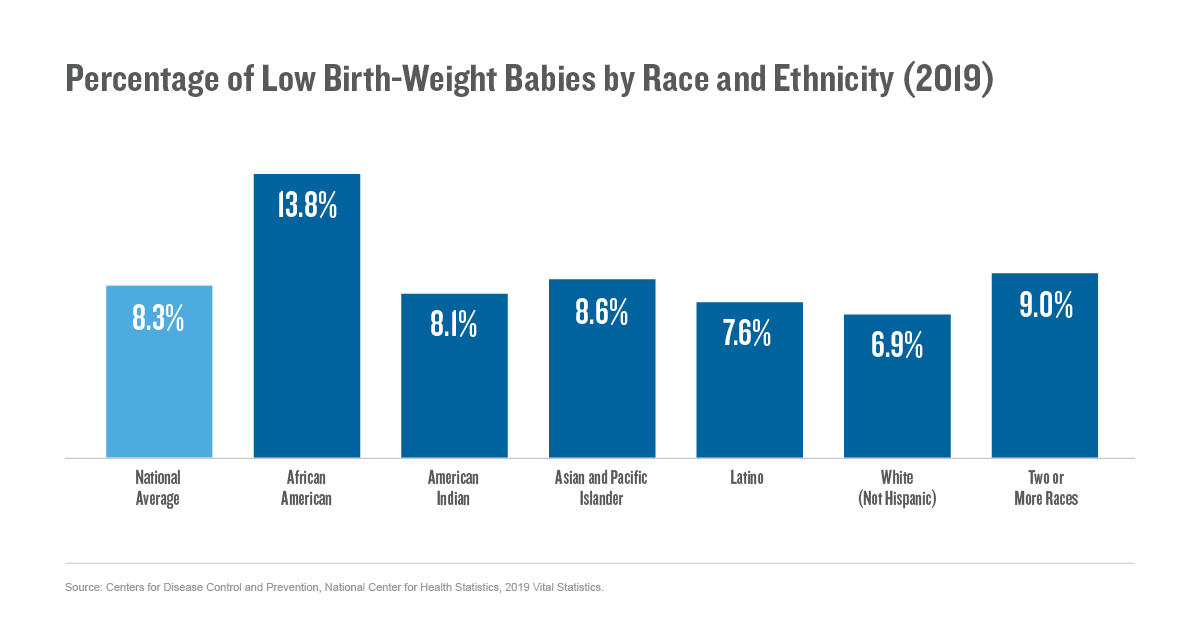
African American Newborns Most Likely to Have Low Birth Weight
Among racial and ethnic groups, African American babies were most likely to be born at a low birth weight, at 13.8% of live births in 2019. This number was close to twice the rates for Latino (7.6%) and white (6.9%) infants. The rate increased from 2016 among all groups except for the rate for white babies, which declined slightly.
Stabilizing Scales
Nationally, low birth-weight babies represented 8.3% of all live births in 2019. After increasing for three straight years, the percentage of babies born at a low birth weight has stabilized. The 2019 rate matched 2006’s four-decade high of 8.3%.
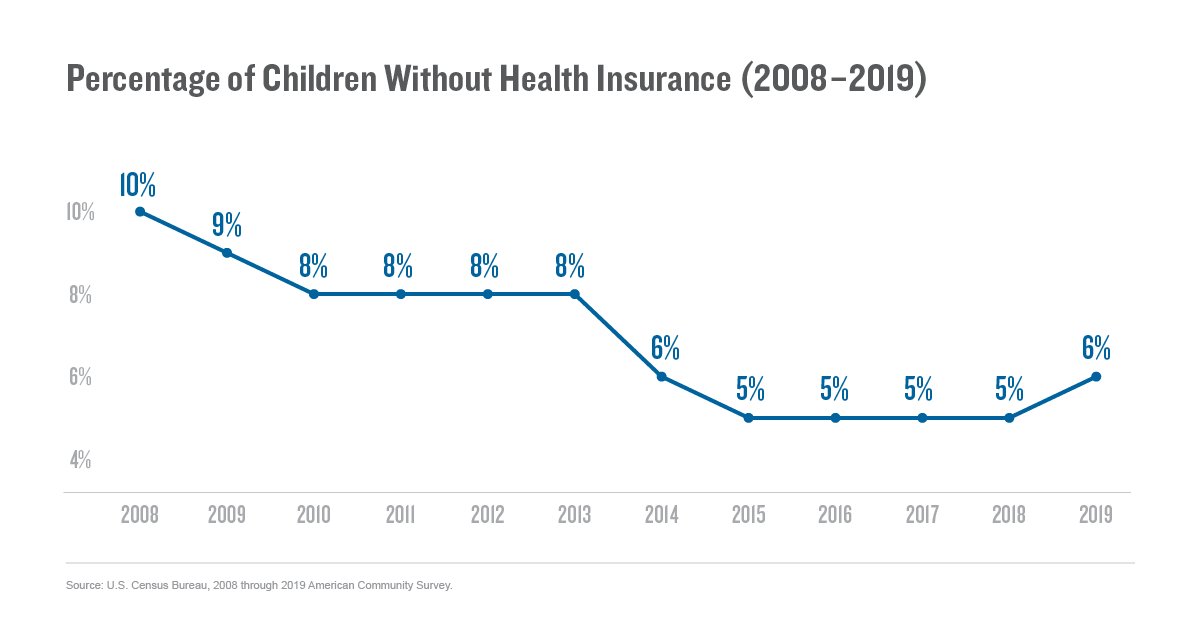
Kids Without Health Insurance Climbs After Steady Decline
Across the nation, 6% of children age 18 and under (4.4 million) lacked health insurance in 2019. This is the first rate increase we have seen in the last decade.
Why Health Insurance Matters
Children with health insurance are more likely to have a regular source of health care they can access for preventive care services and developmental screenings, to treat acute and chronic conditions or to address injuries when they occur.
American Indian (14%) and Latino (9%) children were far more likely to be uninsured than their African American (5%), and Asian and Pacific Islander, multiracial and white peers — each of whom had uninsured rates of 4%.
Why Weight Matters
Being overweight or obese during childhood can have harmful effects on a child’s overall health and well-being and can have everlasting impact on their health as adults. Children who struggle with their weight are at higher risk for a range of health problems, including asthma, heart disease, diabetes and cancer. They are also more likely to experience social and emotional difficulties, such as stigmatization and low self-esteem.
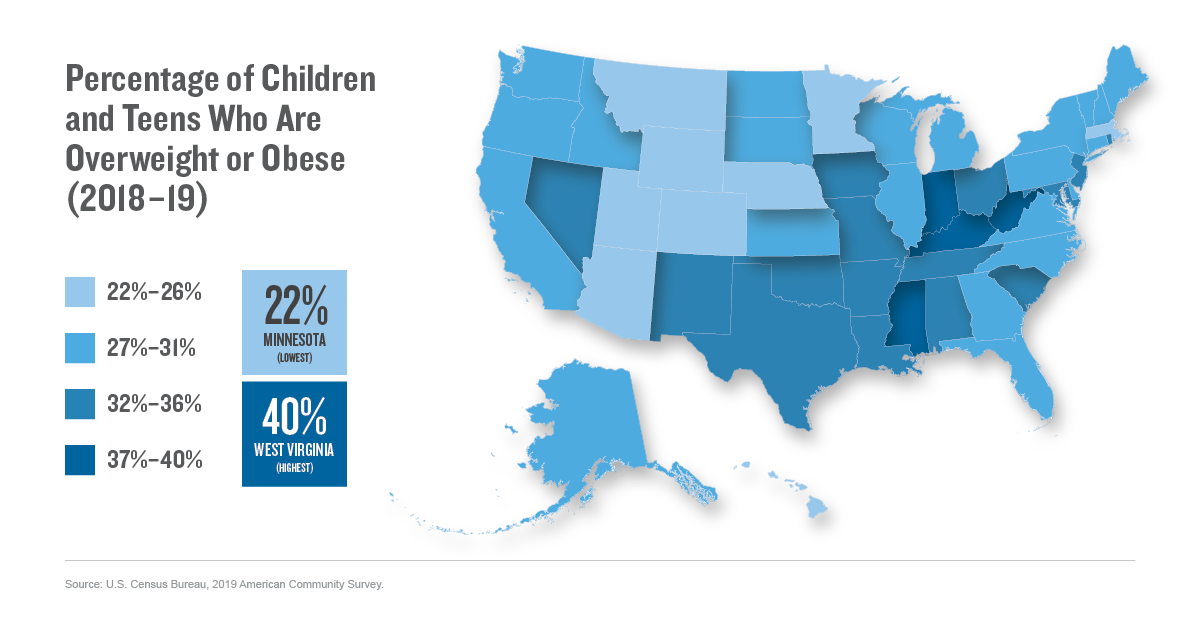
West Virginia Tops the Scales
Minnesota had the lowest rate of children who were overweight or obese (22%). West Virginia, at 40%, had the highest rate.
Percentage of Overweight or Obese Children Unchanged
In 2018–19, 31% of children ages 10 to 17 were overweight or obese. The rate has remained unchanged since 2016-17.
Among racial and ethnic groups, Asian teens were the least likely (18%) to be overweight or obese, while African American (40%) and Latino (38%) youth were the most likely.
Family and Community
Children who live in nurturing families and supportive communities have stronger personal connections and realize higher academic achievements. Explore Family and Community data on the interactive KIDS COUNT Data Book.
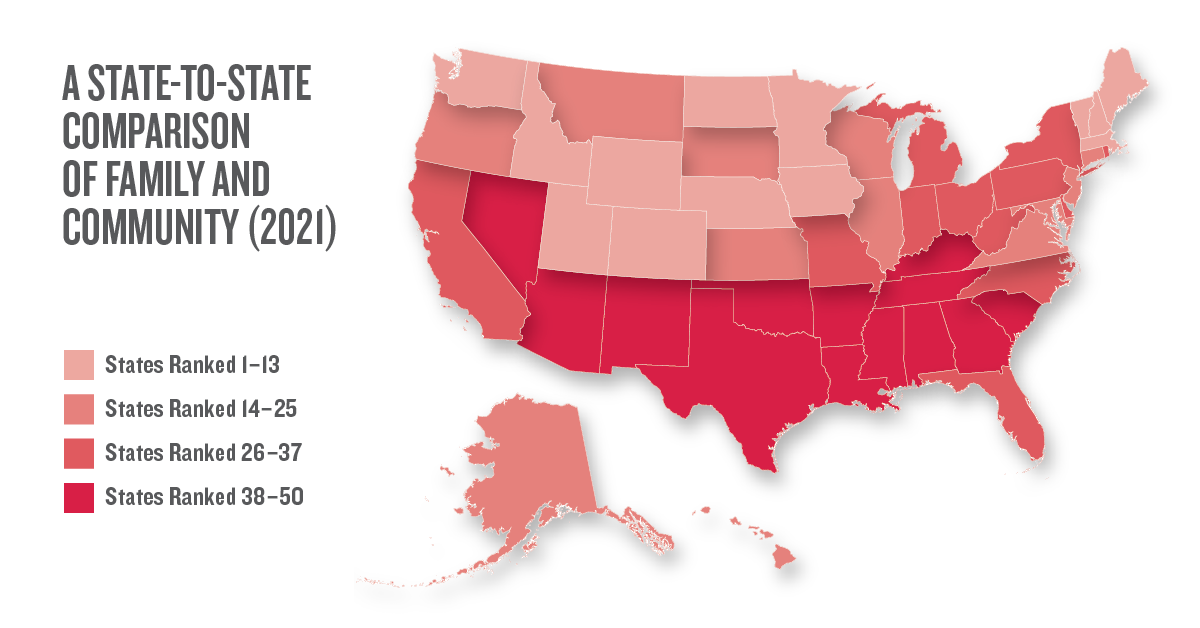
A State-to-State Comparison
In the Family and Community domain, New Hampshire ranks first, followed by Utah and Vermont. New Mexico (48th), Louisiana (49th) and Mississippi (50th) are the three lowest-ranked states.
Percentage of Children in Single-Parent Families Lowest in Utah
The percentage of children living in single-parent families has remained unchanged between 2010 and 2019. In 2019, 34% of children (23.8 million) lived in single-parent families. At the state level, the percentage of children living in single-parent families in 2019 ranged from a low of 19% in Utah to a high of 47% in Louisiana. The share was even higher in Puerto Rico (63%) and the District of Columbia (53%).
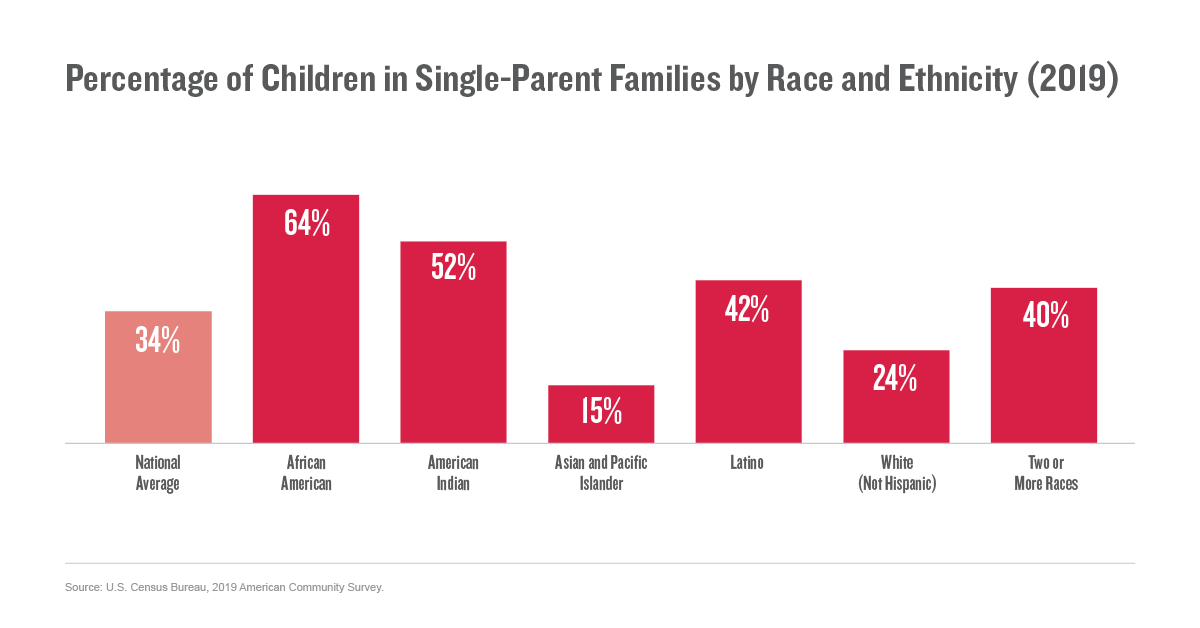
Black and American Indian Children Most Likely to Grow Up in Single-Parent Families
Two-thirds of African American children (64%), more than half of American Indian children (52%) and two-fifths of Latino and multiracial children (42% and 40%, respectively) lived in single-parent families in 2019.
2021 State Data Profiles on Kids' Well-Being
View the national data profile (also available in Spanish) or download your state's data profile as a PDF below:
- Alabama
- Alaska
- Arizona
- Arkansas
- Arkansas (Spanish)
- California
- California (Spanish)
- Colorado
- Colorado (Spanish)
- Connecticut
- Connecticut (Spanish)
- Delaware
- District of Columbia
- District of Columbia (Spanish)
- Florida
- Florida (Spanish)
- Georgia
- Georgia (Spanish)
- Hawaii
- Idaho
- Illinois
- Illinois (Spanish)
- Indiana
- Indiana (Spanish)
- Iowa
- Kansas
- Kentucky
- Kentucky (Spanish)
- Louisiana
- Maine
- Maryland
- Maryland (Spanish)
- Massachusetts
- Michigan
- Minnesota
- Mississippi
- Missouri
- Montana
- Nebraska
- Nevada
- Nevada (Spanish)
- New Hampshire
- New Jersey
- New Jersey (Spanish)
- New Mexico
- New Mexico (Spanish)
- New York
- New York (Spanish)
- North Carolina
- North Dakota
- Ohio
- Oklahoma
- Oklahoma (Spanish)
- Oregon
- Oregon (Spanish)
- Pennsylvania
- Pennsylvania (Spanish)
- Puerto Rico
- Puerto Rico (Spanish)
- Rhode Island
- Rhode Island (Spanish)
- South Carolina
- South Dakota
- Tennessee
- Tennessee (Spanish)
- Texas
- Texas (Spanish)
- Utah
- Utah (Spanish)
- Vermont
- Virginia
- Washington
- West Virginia
- Wisconsin
- Wisconsin (Spanish)
- Wyoming
- Wyoming (Spanish)
Source: Annie E. Casey Foundation 6.21.2021 https://www.aecf.org