Key findings
-
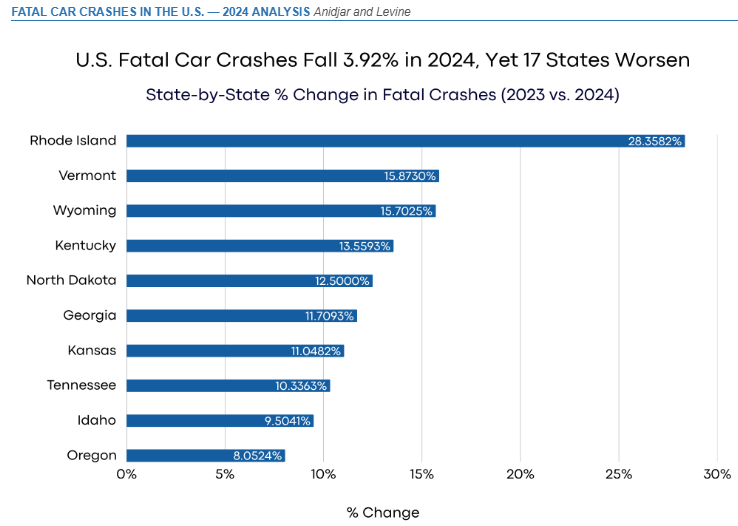
Vermont ranks #2 out of 50 states at -15.9%, from 63 in 2023 to 53 in 2024, making it one of the strongest performers nationwide, ahead of Wyoming (-15.7%), Kentucky (-13.6%), and North Dakota (-12.5%).
-
Vermont trails only Rhode Island (-28.36%)
-
10 fewer fatal crashes in a state where every single incident carries outsized weight due to Vermont's small population and rural road network.
-
17 states saw fatal crashes rise while Vermont moved sharply in the opposite direction, outperforming 48 other states in percentage terms.
- Compared to Maine’s 31.50% increase, the worst in the nation, Vermont’s decline reflects a 47.37 percentage-point difference, underscoring a sharp divide in road safety outcomes.
Vermont Business Magazine Fatal car crashes in Vermont plunged 15.9%, that's 10 fewer deadly crashes to push the total from 63 down to 53. A new 50-state analysis from Anidjar & Levine ranks Vermont #2 for the steepest fatal crash decline in America.
Only Rhode Island's -28.4% outpaced Vermont, while Vermont's drop is 12 percentage points above the national average of -3.92%.
America’s roads continue to claim thousands of lives each year, but progress varies widely by state. In 2024, Vermont emerged as one of the nation’s top performers, recording a significant decline in fatal crashes. With fatalities falling 15.87%, from 63 to 53, the state stands just behind Rhode Island, highlighting how sustained safety efforts can deliver strong results.
This study, conducted by Anidjar & Levine, analyzed the fatal crash data via the reporting system (FARS), the U.S. Department of Transportation. State-level fatal crash totals for 2023 and 2024 were compared across all 50 states. States are ranked by percentage change, with the largest declines ranked first.
VERMONT’S FATAL MOTOR VEHICLE CRASH TRENDS (2023–2024)
VERMONT VS. THE TOP 10 STATES: LEADING THE NATION IN FATAL CRASH REDUCTION
Vermont’s 15.87% decline places it firmly in second position, but still well behind Rhode Island’s 28.36% drop, highlighting a notable performance gap at the very top. While it narrowly leads Wyoming (-15.70%), Vermont stands out as the strongest performer within the second tier of states, clearly ahead of the rest of the top 10 but not quite matching the scale of Rhode Island’s improvement.
VERMONT VS. AMERICA’S WORST-PERFORMING STATES IN FATAL CRASH TRENDS
Vermont’s strong decline contrasts sharply with the bottom five states, all of which recorded increases. While not as extreme as Rhode Island, Vermont still shows a substantial divergence, with a 47.37 percentage-point gap compared to Maine, reinforcing a clear divide in road safety outcomes.
METHODOLOGY
This analysis covers fatal motor vehicle crash totals for all 50 U.S. states for calendar years 2023 and 2024, sourced from the Fatality Analysis Reporting System (FARS) via the U.S. Department of Transportation's crash data query tool at cdan.dot.gov/query. The 2024 state-level data was officially released on April 3, 2026. Percentage change was calculated by subtracting 2023 crash totals from 2024 totals, dividing by the 2023 total, and multiplying by 100. States are ranked by percentage decline, with the largest reductions ranked first; worsening-state tables are sorted by the largest percentage increases.
DATA SOURCES
Fatality Analysis Reporting System (FARS) — U.S. Department of Transportation, National Highway Traffic Safety Administration (NHTSA)
Query Tool: https://cdan.dot.gov/query
Research Dataset: https://docs.google.com/spreadsheets/d/1JtWkq1TN9meVCgfF_x03AbyemVKM6Q2M0hu-p8MFvNQ/edit?gid=0#gid=0
Data Sources: https://www.anidjarlevine.com/
To support vital journalism, access our archives and get unique features like our award-winning profiles, Book of Lists & Business-to-Business Directory, subscribe HERE!
 Vermont Business Magazine