
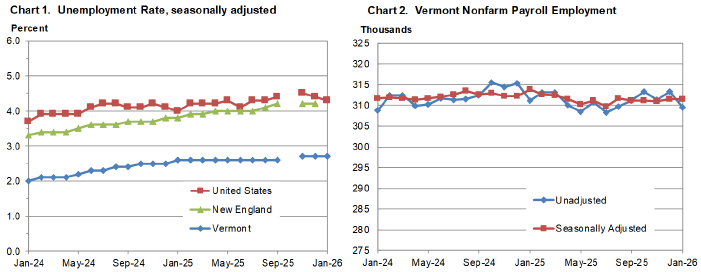
by Timothy McQuiston, Vermont Business Magazine Today, the Vermont Department of Labor released the January 2026 unemployment rate. According to household data, the seasonally adjusted statewide unemployment rate for January was 2.7 percent. This reflects no change from the prior month’s revised estimate (which had been 2.6%). The Vermont jobless rate has not been this high since December 2021 (2.8%). Still, Vermont's jobless rate is tied for fourth lowest in the nation. Hawaii and South Dakota are tied for first (2.2%) and California and Delaware are tied for highest (5.4%).
The comparable United States rate in January was 4.3 percent, a decrease of one-tenth of one percentage point from the revised December estimate.
The civilian labor force participation rate was 63.5 percent in January, a decrease of two-tenths of one percentage point from the prior month’s revised estimate.
“At the same time, these trends underscore the significant opportunities that remain for job seekers and students to find career pathways that work for them in Vermont and step into in-demand roles across our economy—particularly through proven, earn-while-you-learn models like Registered Apprenticeships. As we recognize National Apprenticeship Week later this month, it’s an important opportunity to highlight these pathways and the role they play in strengthening Vermont’s workforce.”
The gaps are due to the government shutdown last fall. USDOL said the data will not be reconfigured.
The seasonally adjusted Vermont data for January show the Vermont civilian labor force decreased by 1,329 from the prior month’s revised estimate (see Table 1). The number of employed persons decreased by 1,361 and the number of unemployed persons increased by 32. None of the changes were statistically significant in the seasonally adjusted series.
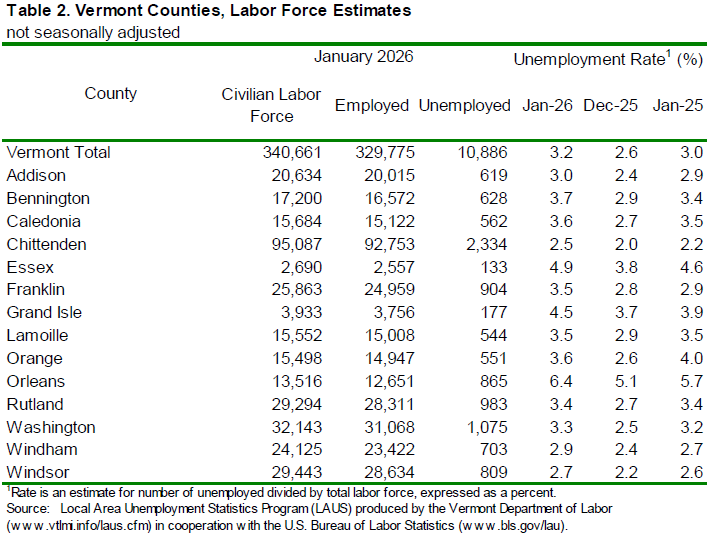
The January unemployment rates for Vermont’s 14 counties ranged from 2.5 percent in Chittenden County to 6.4 percent in Orleans County (note: county unemployment rates are not seasonally-adjusted – see Table 2). For comparison, the January unadjusted unemployment rate for Vermont was 3.2 percent, an increase of six-tenths of one percentage point from the revised unadjusted December level and an increase of two-tenths of one percentage point from a year ago.
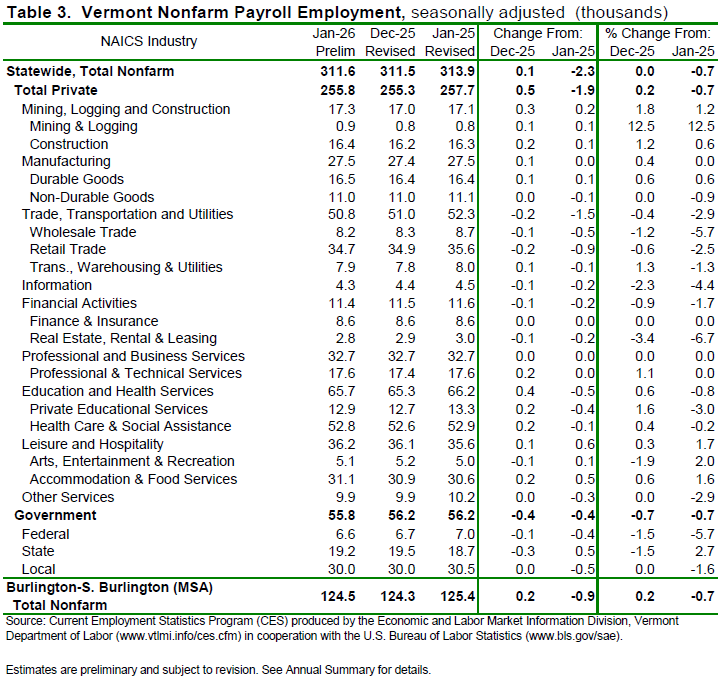
Seasonally Adjusted (Table 3)
The seasonally adjusted data for January reported an increase of 100 jobs from the revised December data. There was a decrease of 2,700 jobs between the preliminary and the revised December estimates due to the inclusion of more data. The seasonally adjusted over-the-month changes in January varied at the industry level. The industries with a notable increase were: Private Educational Services (+200 jobs or +1.6%), Construction (+200 jobs or +1.2%), and Professional & Technical Services (+200 jobs or +1.1%). The industry with a notable decrease was State Government (-300 jobs or -1.5%).
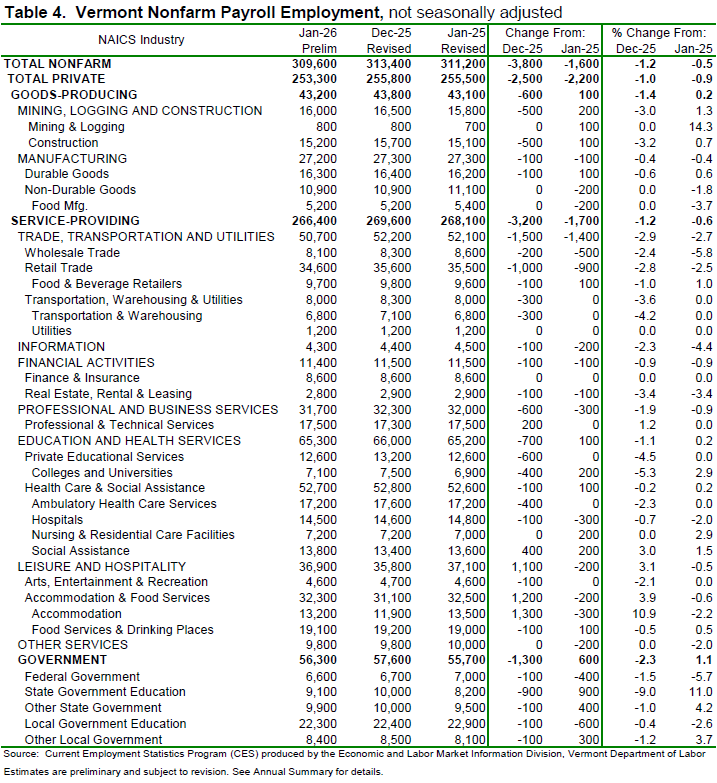
Not-Seasonally-Adjusted (Table 4)
The preliminary ‘not-seasonally-adjusted’ jobs estimates for January showed a decrease of 3,800 jobs when compared to the revised December numbers. As with the seasonally adjusted data, this over-the-month change is from the revised December numbers which experienced a decrease of 3,100 jobs from the preliminary estimates. The broader economic picture can be seen by focusing on the over-the-year changes in this data series. As detailed in the preliminary not-seasonally-adjusted January data, Total Private industries decreased by 2,200 jobs (-0.9%) over the year and Government (including public education) employment increased by 600 jobs (+1.1%) in the past year.
*** BLS note on CES series drops in 2026: https://www.bls.gov/sae/notices/2026/notice-of-publication-changes-with-the-release-of-january-2026-data.htm ***
The Unemployment and Jobs Report for February is scheduled to be released on Wednesday, April 22, 2026, at 10:00 a.m.
| State | January 2026(p) rate |
Rank |
|---|---|---|
|
Hawaii |
2.2 | 1 |
|
South Dakota |
2.2 | 1 |
|
North Dakota |
2.6 | 3 |
|
Alabama |
2.7 | 4 |
|
Vermont |
2.7 | 4 |
|
Nebraska |
3.0 | 6 |
|
New Hampshire |
3.2 | 7 |
|
Maine |
3.3 | 8 |
|
Wisconsin |
3.3 | 8 |
|
Indiana |
3.4 | 10 |
|
Iowa |
3.4 | 10 |
|
Georgia |
3.5 | 12 |
|
Tennessee |
3.5 | 12 |
|
Mississippi |
3.6 | 14 |
|
Montana |
3.6 | 14 |
|
Wyoming |
3.6 | 14 |
|
Idaho |
3.7 | 17 |
|
Virginia |
3.7 | 17 |
|
North Carolina |
3.8 | 19 |
|
Utah |
3.8 | 19 |
|
Colorado |
3.9 | 21 |
|
Kansas |
3.9 | 21 |
|
Missouri |
3.9 | 21 |
|
Oklahoma |
3.9 | 21 |
|
Kentucky |
4.3 | 25 |
|
Louisiana |
4.3 | 25 |
|
Maryland |
4.3 | 25 |
|
Ohio |
4.3 | 25 |
|
Pennsylvania |
4.3 | 25 |
|
Texas |
4.3 | 25 |
|
Arkansas |
4.4 | 31 |
|
Minnesota |
4.4 | 31 |
|
Arizona |
4.5 | 33 |
|
Connecticut |
4.5 | 33 |
|
Florida |
4.5 | 33 |
|
New Mexico |
4.5 | 33 |
|
Rhode Island |
4.5 | 33 |
|
New York |
4.6 | 38 |
|
West Virginia |
4.6 | 38 |
|
Massachusetts |
4.7 | 40 |
|
Alaska |
4.8 | 41 |
|
Illinois |
4.9 | 42 |
|
South Carolina |
4.9 | 42 |
|
Michigan |
5.0 | 44 |
|
Washington |
5.0 | 44 |
|
New Jersey |
5.2 | 46 |
|
Oregon |
5.2 | 46 |
|
Nevada |
5.3 | 48 |
|
California |
5.4 | 49 |
|
Delaware |
5.4 | 49 |
|
District of Columbia |
6.7 | 51 |
|
Footnotes |
||
|
Note: Rates shown are a percentage of the labor force. Data refer to place of residence. Estimates for the current month are subject to revision the following month. |
||
Last Modified Date: USDOL. April 8, 2026
To support vital journalism, access our archives and get unique features like our award-winning profiles, Book of Lists & Business-to-Business Directory, subscribe HERE!
