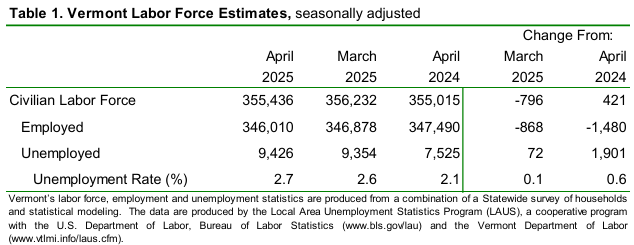
by Timothy McQuiston, Vermont Business Magazine Today, the Vermont Department of Labor reported that the seasonally adjusted statewide unemployment rate for April was 2.7 percent. This reflects an increase of one-tenth of one percentage point from the prior month’s revised estimate. The Labor Force and the number of Employed both fell, while the number of Unemployed increased slightly. The civilian labor force participation rate was 65.1 percent in April, a decrease of two-tenths of one percentage point from the prior month’s revised estimate.
Vermont now is tied for the third lowest jobless rate in the US, after being second lowest for many months. Vermont is tied with Montana and is below South (1.8%) and North Dakota (2.6%). Nevada continues to have the highest rate (5.6%). The comparable United States rate in April was 4.2 percent, no change from the revised March estimate.
SEE DATA TABLES BELOW
Michael Harrington, Vermont Labor Commissioner, said: “The start of 2025 has shown downward pressure on Vermont’s labor force. This is likely driven by the number of mature workers who are retiring, leaving great career opportunities for job seekers and young Vermonters entering the workforce. As the school year ends, it is a great time to engage youth in these conversations, and the Vermont’s Most Promising Jobs brochure is a great starting point: https://www.vtlmi.info/pathways.pdf.
"Additionally, the Department of Labor’s Job Centers provide support services, mentoring, and paid on-the-job training opportunities for youth to highlight these pathways. Learn more about the Vermont Youth Employment Program by visiting: https://labor.vermont.gov/VYEP.”
The seasonally adjusted Vermont data for April show the Vermont civilian labor force decreased by 796 from the prior month’s revised estimate (see Table 1).
The number of employed persons decreased by 868 and the number of unemployed persons increased by 72. No changes were statistically significant in the seasonally adjusted series.
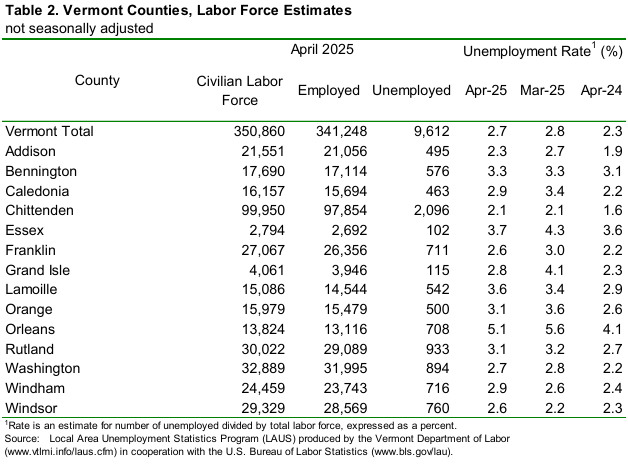
The April unemployment rates for Vermont’s 14 counties ranged from 2.1 percent in Chittenden County to 5.1 percent in Orleans County (note: county unemployment rates are not seasonally adjusted – see Table 2).
For comparison, the April unadjusted unemployment rate for Vermont was 2.7 percent, a decrease of one-tenth of one percentage point from the revised unadjusted March level and an increase of four-tenths of one percentage point from a year ago.
*** BLS note on LAUS geography and data changes in 2025: https://www.bls.gov/lau/geography and-data-changes-in-2025.htm (SEE ALSO BELOW).
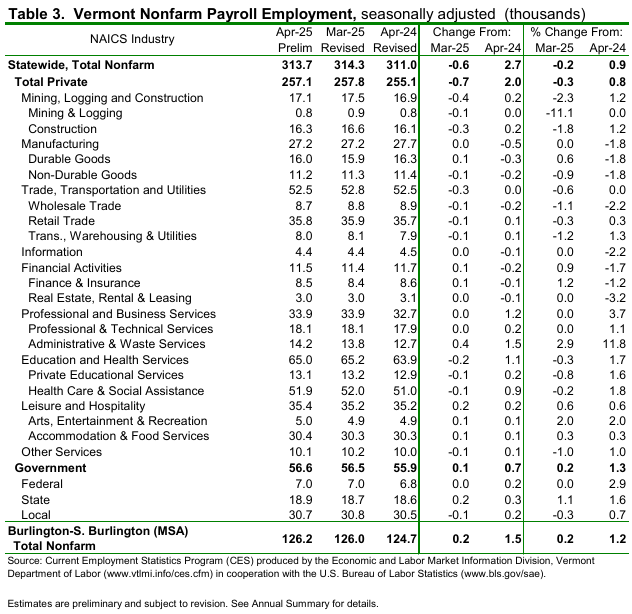
Seasonally Adjusted (Table 3)
The seasonally adjusted data for April reported a decrease of 600 jobs from the revised March data. There was an increase of 200 jobs between the preliminary and the revised March estimates due to the inclusion of more data. The seasonally adjusted over-the-month changes in April varied at the industry level. The industries with a notable increase were Administrative & Waste Services (+400 jobs or +2.9%) and State Government (+200 jobs or +1.1%). The industry with a notable decrease was Construction (-300 jobs or -1.8%).
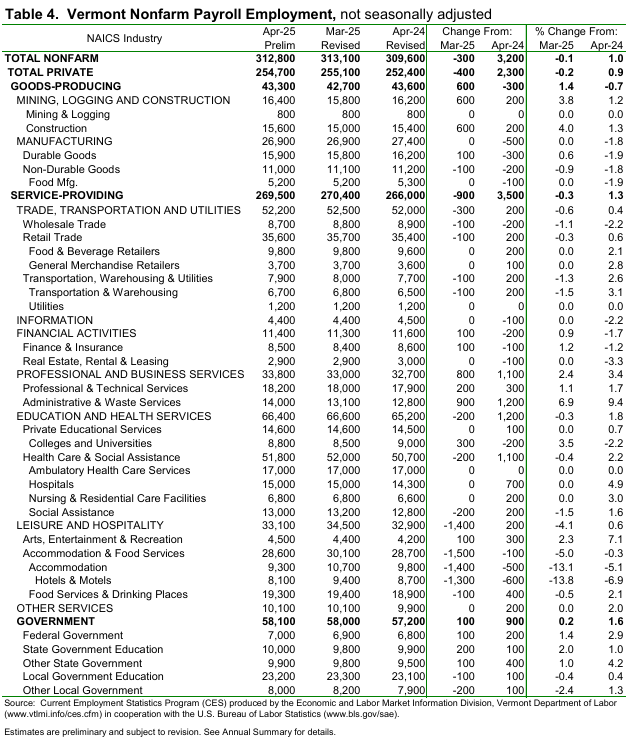
Not-Seasonally-Adjusted (Table 4)
The preliminary ‘not-seasonally-adjusted’ jobs estimates for April showed a decrease of 300 jobs when compared to the revised March numbers. As with the seasonally adjusted data, this over the-month change is from the revised March numbers which experienced a decrease of 500 jobs from the preliminary estimates. The broader economic picture can be seen by focusing on the over-the-year changes in this data series. As detailed in the preliminary not-seasonally-adjusted April data, Total Private industries increased by 2,300 jobs (+0.9%) over the year and Government (including public education) employment increased by 900 jobs (+1.6%) in the past year.
The Unemployment and Jobs Report for May is scheduled to be released on Tuesday, June 24, 2025, at 10:00 a.m.

LAUS Geography and Data Changes in 2025
Each decade, the Local Area Unemployment Statistics (LAUS) program implements new federal statistical areas delineations issued by the Office of Management and Budget (OMB) following the decennial census. In addition to these geographic changes, the 2024 annual processing cycle in early 2025 incorporated synthetic intercensal population controls for model-based areas and updated American Community Survey (ACS) and decennial census inputs to substate estimation.
Geographic Changes
With the release of January 2025 data on March 17, 2025, the LAUS estimates for federal statistical areas, including metropolitan and micropolitan statistical areas, metropolitan divisions, and combined statistical areas, were updated to reflect the delineations based on the 2020 Census, as published in OMB Bulletin No. 23-01. For the six New England states, New England City and Town Areas (NECTAs) were discontinued, and LAUS began publishing the areas and divisions made up of counties or county equivalents. New geography for all areas was carried back to the series beginnings in January 1990.
Three of the program's seven modeled substate areas (those that are estimated using time-series models similar to those for states) had geographic delineation changes in OMB Bulletin No. 23-01: the Chicago-Naperville-Schaumburg, IL metropolitan division (formerly Chicago-Naperville-Arlington Heights) dropped a county; the Cleveland, OH metropolitan area (formerly Cleveland-Elyria) added a county; and the former Seattle-Bellevue-Everett, WA metropolitan division split into two metropolitan divisions. For the latter, rather than continuing to model the metropolitan division, the LAUS program switched to modelling the Seattle-Tacoma-Bellevue, WA metropolitan area. Data for these three modeled areas and their respective balances of state was re-estimated back to their series beginnings. Due to CPS sample availability, the series start year for the Cleveland and Seattle metropolitan areas became 1994, rather than 1990.
In addition, the previous eight counties in Connecticut were replaced by nine planning regions, which serve as county equivalents. See the Federal Register Notice for more information. This change was also carried back to January 1990.
See the LAUS Geographic Concepts page for more information about LAUS geography.
Intercensal population controls for modeled areas
Changes in the decennial census basis for the civilian noninstitutional population ages 16 and older (CNP16+) recontrol series often entail level breaks due to "error of closure," which is defined as the difference between the final, post-censal estimates for April of the new decennial base year as extrapolated 10 years past the prior census and the enumerated data from the latest census. Intercensal estimates are produced each decade by adjusting the existing time series of postcensal estimates for a decade to smooth the transition from one decennial census count to the next. Previously, during the 2021 annual processing cycle in early 2022, the LAUS program implemented wedged population recontrols for the 2010s as a temporary measure until intercensal state population controls for the decade became available. These wedged population recontrols were implemented from January 2017 through March 2020, resulting in breaks in some areas between December 2016 and January 2017.
For the 2024 annual processing cycle, BLS developed synthetic state intercensal population controls for CNP16+ from January 1980 through April 2020. These population data were developed using standard demographic methods historically employed by the Census Bureau's Population Estimates Program. However, the endpoints for the intercensal series for the 2010s are the April 2020 "blended base" estimates, rather than the enumerated count. In addition to addressing the breaks from the 2020 Census, these controls help smooth breaks appearing in previous decennial census years and improve the time series quality of the published state CNP16+ data. These CNP16+ intercensal population controls were used to recontrol the Current Population Survey (CPS) employment status estimates used as inputs to the LAUS time series models for states, census divisions, and modeled substate areas prior to model re-estimation back to the series beginnings. In addition, they replaced existing published CNP16+ data for all states, the District of Columbia, the Los Angeles-Long Beach-Glendale, CA Metropolitan Division, and New York City in the public BLS database.
Updated inputs to substate estimation
Below the state level, the LAUS program produces estimates using the Handbook method, a building-block approach that utilizes inputs from a number of administrative and survey data sources, including the Census Bureau's American Community Survey (ACS) and the decennial census. While many inputs, such as non-agricultural wage and salary employment estimates and unemployment insurance claims counts, are updated both monthly and annually, certain inputs to Handbook estimation are generally only updated once per decade.
- Dynamic residency ratios (DRRs) are used to adjust place-of-work employment estimates to the place-of-residence concept of the CPS, using commutation data from the ACS. In 2025, DRRs were updated to reflect relationships from the most recent 2016-2020 ACS "Journey to Work" dataset.
- The Handbook method uses ratios developed from the ACS to allocate inputs from higher levels of geography to lower levels. In 2025, these ratios were updated using the most recent 5-year ACS dataset, for 2019-2023.
- Several aspects of the Handbook method incorporate population data annually that are affected by closing error when official population series switch to a new decennial census basis. Population-based components for the Handbook method were updated in 2025 to smooth out the closing error for the 2020 Census.
Summary of data changes by area type and timing of publication
All areas published by the LAUS program will be affected by the changes described above, and data for all areas will be replaced in the time-series database in 2025.
- Estimates for census divisions, states, the District of Columbia, New York City, the Los Angeles-Long Beach-Glendale Metropolitan Division, and the balances of New York and California had their model-based series re-estimated from 1976 forward to incorporate new intercensal population controls, as well as the typical annual updates to the covariate inputs. The published CNP16+ series for these areas was also replaced. These estimates were published on March 5, 2025, in conjunction with the Regional and State Annual Averages news release for 2024.
- Modeled estimates for the Detroit-Warren-Dearborn, MI metropolitan area and the Miami-Miami Beach-Kendall, FL metropolitan division and their respective balances of state incorporated updated intercensal population controls and input revisions back to 1990. Additionally, the Chicago-Naperville-Schaumburg, IL metropolitan division, the Cleveland, OH metropolitan area, the Seattle-Tacoma-Bellevue, WA metropolitan area, and the respective balances of state were re-estimated back to 1994 to reflect the updated geographic delineations. These data were published along with the preliminary January 2025 state estimates on March 17, 2025.
- Estimates for non-modeled metropolitan areas, metropolitan divisions, micropolitan areas, small labor market areas, and counties were adjusted for the new geographic delineations and controlled to the new model area totals back to the series beginnings in 1990. Data reflecting these changes were published on March 17, 2025. The data for 1990-2015 are considered final, while the data for 2016 forward were marked as "provisional." Final data for these non-modeled areas from 2016-2024, reflecting the once-per-decade ACS and decennial census input updates for the Handbook method, as well as the typical annual input revisions, were published on April 18, 2025.
- Areas below the county level, including cities, city parts, and minor civil divisions, are disaggregated from their respective counties. Cities and towns in the six New England states, which previously served as the building-blocks for the Handbook method in those states, are now disaggregated from the county level, using the same methods as all other states. Data for all years were ratio-adjusted to coincide with new county controls. As with the other substate areas, revised data for these areas were published on March 17, 2025, with estimates for 1990-2015 considered final and estimates for 2016-2024 marked as "provisional." Final data for 2016-2024 reflecting updated disaggregation ratios, as well as the typical annual updates to state-supplied inputs, were published on April 18, 2025.
Last Modified Date: April 18, 2025
| State | April 2025(p) rate |
Rank |
|---|---|---|
|
South Dakota |
1.8 | 1 |
|
North Dakota |
2.6 | 2 |
|
Montana |
2.7 | 3 |
|
Vermont |
2.7 | 3 |
|
Hawaii |
2.9 | 5 |
|
Nebraska |
3.0 | 6 |
|
Maryland |
3.1 | 7 |
|
New Hampshire |
3.1 | 7 |
|
Utah |
3.1 | 7 |
|
Minnesota |
3.2 | 10 |
|
Oklahoma |
3.2 | 10 |
|
Alabama |
3.3 | 12 |
|
Virginia |
3.3 | 12 |
|
Wisconsin |
3.3 | 12 |
|
Wyoming |
3.3 | 12 |
|
Iowa |
3.5 | 16 |
|
Maine |
3.5 | 16 |
|
Tennessee |
3.5 | 16 |
|
Georgia |
3.6 | 19 |
|
Arkansas |
3.7 | 20 |
|
Connecticut |
3.7 | 20 |
|
Florida |
3.7 | 20 |
|
Idaho |
3.7 | 20 |
|
North Carolina |
3.7 | 20 |
|
Kansas |
3.8 | 25 |
|
West Virginia |
3.8 | 25 |
|
Delaware |
3.9 | 27 |
|
Indiana |
3.9 | 27 |
|
Missouri |
3.9 | 27 |
|
Pennsylvania |
3.9 | 27 |
|
Mississippi |
4.0 | 31 |
|
Arizona |
4.1 | 32 |
|
Texas |
4.1 | 32 |
|
New York |
4.2 | 34 |
|
South Carolina |
4.2 | 34 |
|
New Mexico |
4.3 | 36 |
|
Louisiana |
4.4 | 37 |
|
Washington |
4.4 | 37 |
|
Massachusetts |
4.6 | 39 |
|
Alaska |
4.7 | 40 |
|
Oregon |
4.7 | 40 |
|
Colorado |
4.8 | 42 |
|
Illinois |
4.8 | 42 |
|
New Jersey |
4.8 | 42 |
|
Ohio |
4.9 | 45 |
|
Rhode Island |
4.9 | 45 |
|
Kentucky |
5.2 | 47 |
|
California |
5.3 | 48 |
|
Michigan |
5.5 | 49 |
|
Nevada |
5.6 | 50 |
|
District of Columbia |
5.8 | 51 |
|
Footnotes |
||
|
Note: Rates shown are a percentage of the labor force. Data refer to place of residence. Estimates for the current month are subject to revision the following month. |
||
Last Modified Date: May 21, 2025
To support vital journalism, access our archives and get unique features like our award-winning profiles, Book of Lists & Business-to-Business Directory, subscribe HERE!
