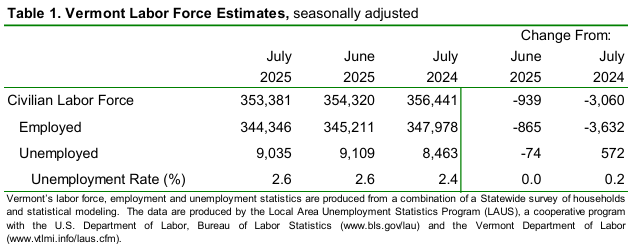
by Timothy McQuiston, Vermont Business Magazine Today, the Vermont Department of Labor reported that the seasonally adjusted statewide unemployment rate for July was 2.6 percent. This reflects no change from the prior month’s revised estimate. The civilian labor force participation rate was 64.7 percent in July, a decrease of two-tenths of one percentage point from the prior month’s revised estimate. Vermont has the third lowest rate in the nation, behind South (1.9%) and North Dakota (2.5%). California has the highest rate at 5.5% (Washington, DC, is at 6%).
The Labor Force and Employment dropped from June and are both now more the 3,000 below their numbers from last year. Because the Labor Force is the denominator in these equations, a decline in both data points does not change the rate. The number of unemployed fell slightly by 74 participants.
"While the pace of economic growth is easing, Vermont’s labor market is still full of opportunity," said Kendal Smith, Interim Commissioner at the Vermont Department of Labor. "This report measures only filled positions, yet with an estimated 17,000 job openings statewide, there’s enormous potential to strengthen our economy by connecting employers with the talent they need. To help close this gap, the Vermont Department of Labor works closely with employers on recruitment strategies and supports job seekers in finding employment and identifying training opportunities. For more information, or to connect with your local Department of Labor office, visit labor.vermont.gov."
The comparable United States rate in July was 4.2 percent, an increase of one-tenth of one percentage point from the revised June estimate. The seasonally adjusted Vermont data for July show the Vermont civilian labor force decreased by 939 from the prior month’s revised estimate (see Table 1). The number of employed persons decreased by 865 and the number of unemployed persons decreased by 74. The change in the labor force participation rate (64.7 percent, down two-tenths of one percentage point) was statistically significant in the seasonally adjusted series.
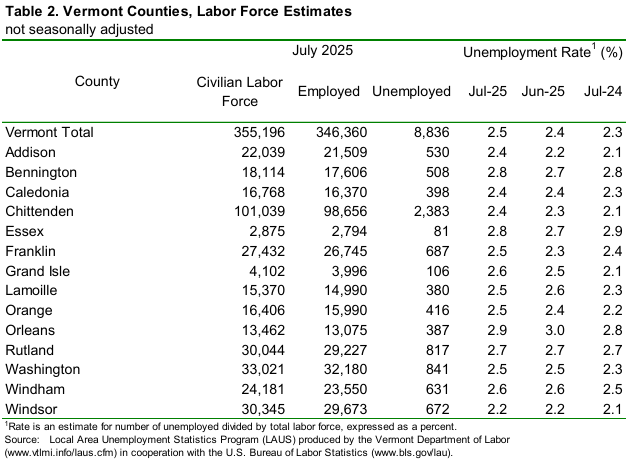
The July unemployment rates for Vermont’s 14 counties ranged from 2.2 percent in Windsor County to 2.9 percent in Orleans County (note: county unemployment rates are not seasonally-adjusted – see Table 2). For comparison, the July unadjusted unemployment rate for Vermont was 2.5 percent, an increase of one-tenth of one percentage point from the revised unadjusted June level and an increase of two-tenths of one percentage point from a year ago.
*** BLS note on LAUS geography and data changes in 2025: https://www.bls.gov/lau/geography-and-data-changes-in-2025.htm ***
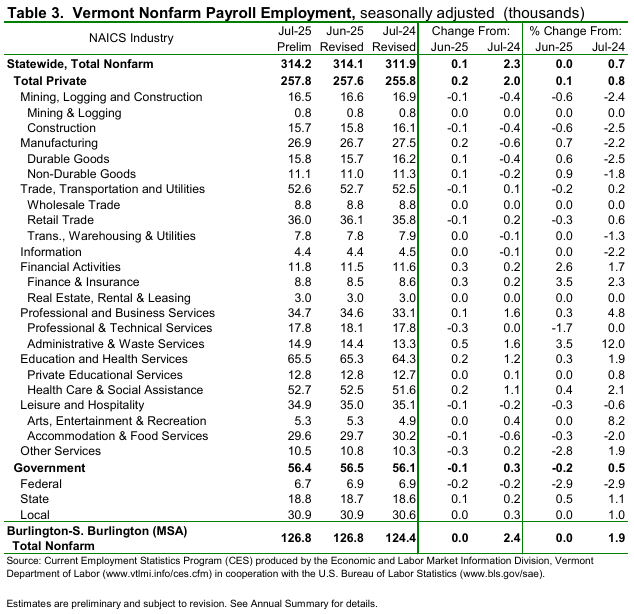
Seasonally Adjusted (Table 3)
The seasonally adjusted data for July reported an increase of 100 jobs from the revised June data. There was a decrease of 100 jobs between the preliminary and the revised June estimates due to the inclusion of more data. The seasonally adjusted over-the-month changes in July varied at the industry level. The industries with a notable increase were: Administrative & Waste Services (+500 jobs or +3.5%) and Finance & Insurance (+300 jobs or +3.5%). The industries with a notable decrease were: Federal Government (-200 jobs or -2.9%), Other Services (-300 jobs or -2.8%), and Professional & Technical Services (-300 jobs or -1.7%).
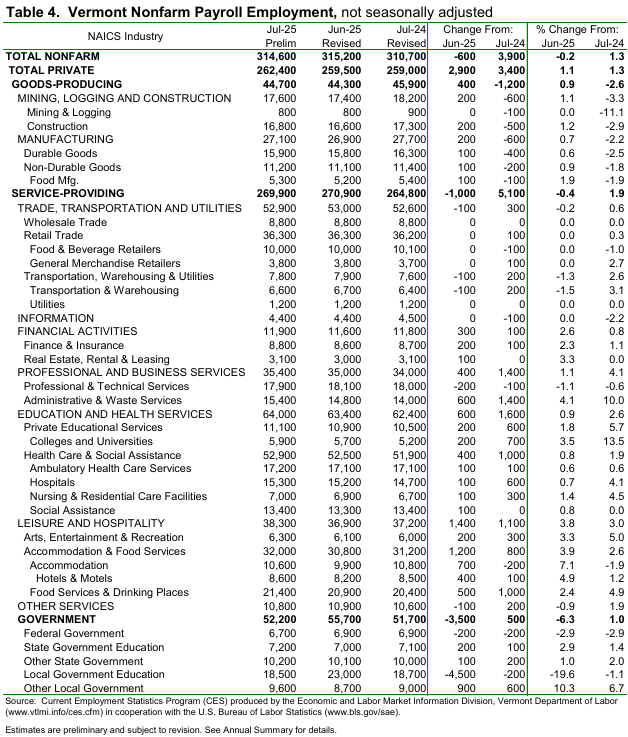
Not-Seasonally-Adjusted (Table 4)
The preliminary ‘not-seasonally-adjusted’ jobs estimates for July showed a decrease of 600 jobs when compared to the revised June numbers. As with the seasonally adjusted data, this over-the-month change is from the revised June numbers which experienced a decrease of 400 jobs from the preliminary estimates. The broader economic picture can be seen by focusing on the over-the-year changes in this data series. As detailed in the preliminary not-seasonally-adjusted July data, Total Private industries increased by 3,400 jobs (+1.3%) over the year and Government (including public education) employment increased by 500 jobs (+1.0%) in the past year.
| State | July 2025(p) rate |
Rank |
|---|---|---|
|
South Dakota |
1.9 | 1 |
|
North Dakota |
2.5 | 2 |
|
Vermont |
2.6 | 3 |
|
Hawaii |
2.7 | 4 |
|
Montana |
2.8 | 5 |
|
Alabama |
3.0 | 6 |
|
Nebraska |
3.0 | 6 |
|
New Hampshire |
3.1 | 8 |
|
Oklahoma |
3.1 | 8 |
|
Wisconsin |
3.1 | 8 |
|
Maine |
3.2 | 11 |
|
Utah |
3.3 | 12 |
|
Wyoming |
3.3 | 12 |
|
Georgia |
3.4 | 14 |
|
Maryland |
3.4 | 14 |
|
Minnesota |
3.5 | 16 |
|
Indiana |
3.6 | 17 |
|
Tennessee |
3.6 | 17 |
|
Virginia |
3.6 | 17 |
|
Arkansas |
3.7 | 20 |
|
Florida |
3.7 | 20 |
|
Idaho |
3.7 | 20 |
|
Iowa |
3.7 | 20 |
|
North Carolina |
3.7 | 20 |
|
West Virginia |
3.7 | 20 |
|
Connecticut |
3.8 | 26 |
|
Kansas |
3.8 | 26 |
|
Mississippi |
4.0 | 28 |
|
New York |
4.0 | 28 |
|
Pennsylvania |
4.0 | 28 |
|
Texas |
4.0 | 28 |
|
Arizona |
4.1 | 32 |
|
Delaware |
4.1 | 32 |
|
Missouri |
4.1 | 32 |
|
New Mexico |
4.2 | 35 |
|
South Carolina |
4.2 | 35 |
|
Colorado |
4.5 | 37 |
|
Louisiana |
4.5 | 37 |
|
Washington |
4.5 | 37 |
|
Illinois |
4.6 | 40 |
|
Alaska |
4.8 | 41 |
|
Massachusetts |
4.8 | 41 |
|
Rhode Island |
4.8 | 41 |
|
Kentucky |
4.9 | 44 |
|
New Jersey |
4.9 | 44 |
|
Ohio |
5.0 | 46 |
|
Oregon |
5.0 | 46 |
|
Michigan |
5.3 | 48 |
|
Nevada |
5.4 | 49 |
|
California |
5.5 | 50 |
|
District of Columbia |
6.0 | 51 |
|
Footnotes |
||
|
Note: Rates shown are a percentage of the labor force. Data refer to place of residence. Estimates for the current month are subject to revision the following month. |
||
Last Modified Date: August 19, 2025
The Unemployment and Jobs Report for August is scheduled to be released on Friday, September 19, 2025, at 10:00 a.m.
Source: 8.19.2025. Vermont DOL vtlmi.info.
To support vital journalism, access our archives and get unique features like our award-winning profiles, Book of Lists & Business-to-Business Directory, subscribe HERE!
