by Timothy McQuiston, Vermont Business Magazine Secretary of Administration Sarah Clark today released Vermont’s revenue results for June 2025. The General Fund, Transportation Fund and Education Fund all lagged their monthly consensus cash flow targets as adopted by the Emergency Board at its January 2025 meeting.
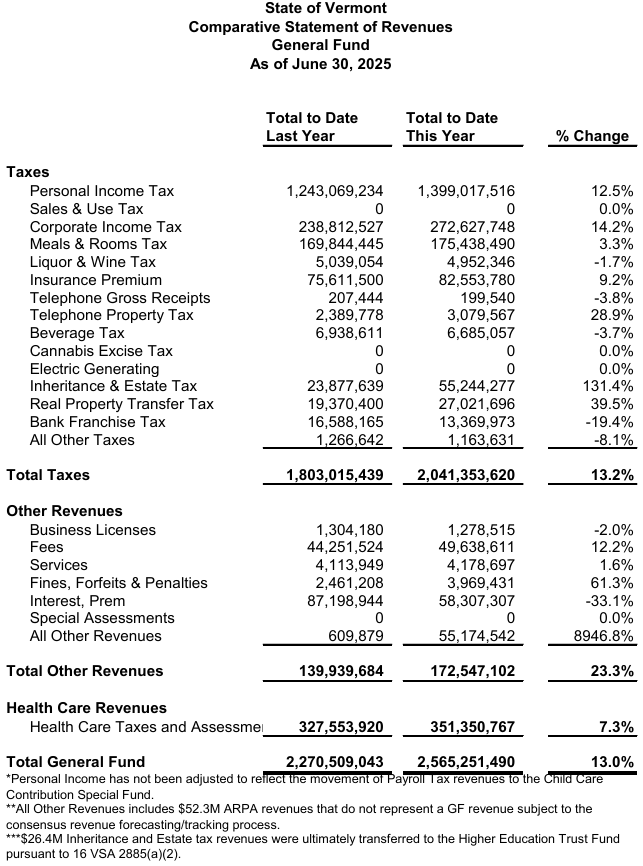
The General Fund finished the fiscal year ahead of the consensus target despite the Personal Income Tax, the GF’s most important revenue source, falling well behind expectations for the month. For the fiscal year, the PI was $66.5 million or 5.1% ahead of targets as the GF finished the year ahead by $88.2 million or 3.7%.
The state economists on July 31 presented their consensus revenue report for the next two fiscal years to the state Emergency Board. They expect the General Fund to remain strong, while the Transportation and Education funds will slightly weaken. Action by the federal government, they note, adds an unprecedented amount of uncertainty to the equations. (See below).
June is the last month of the fiscal year.
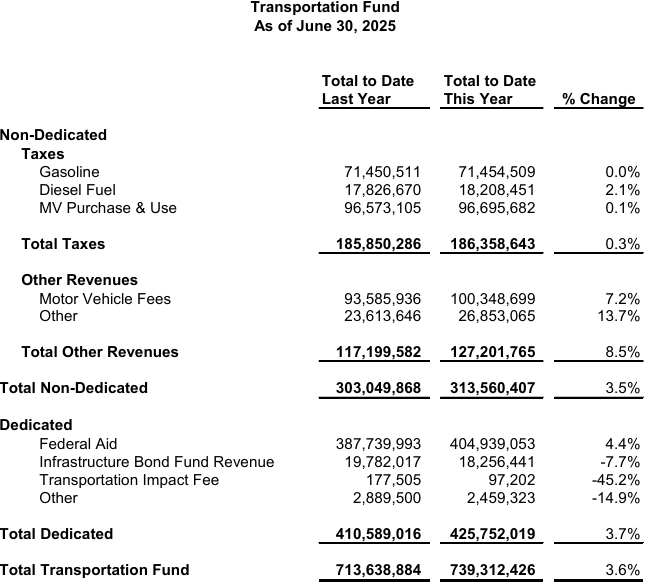
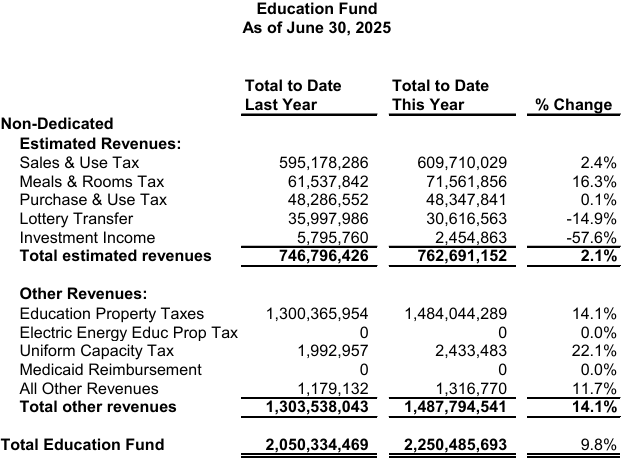
Meanwhile, the Education Fund for FY25 was on target, while the Transportation fund ended the year behind target (-$7.4 million or -2.3%).
For the month of June, the three major fund receipts were a combined $299.5 million, underperforming the $312.4 million monthly consensus target by -$15.3 million, or -5.3%.
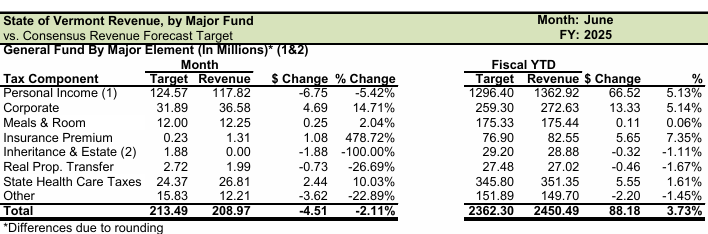
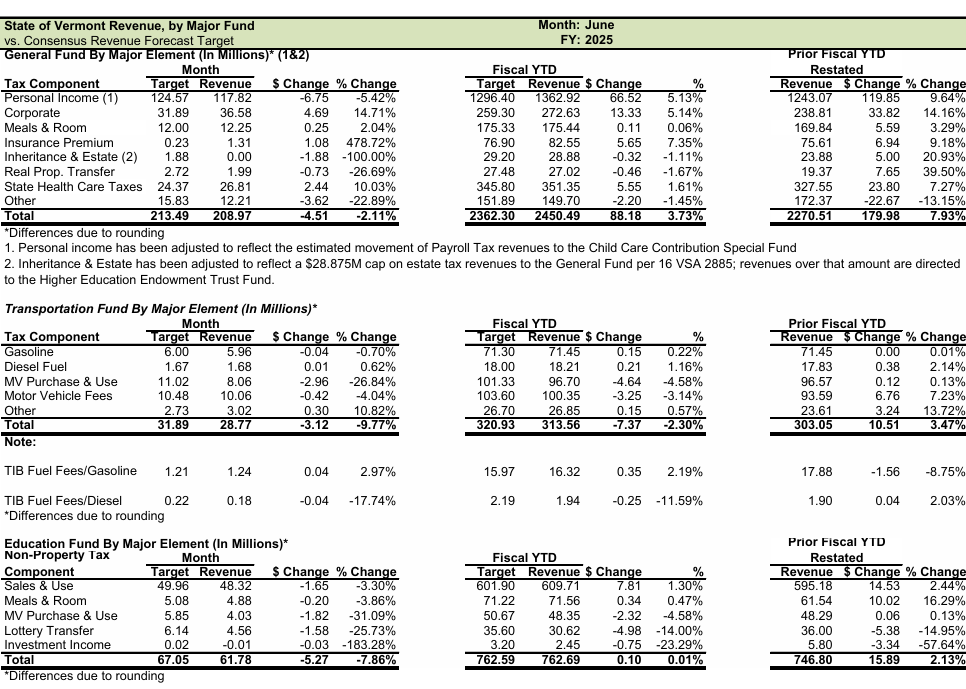
Total General Fund revenues for June were $208.9 million, -$4.5 million, or 2.1%, below the $213.5 million monthly consensus cash flow target. This was driven primarily by the underperformance of Personal Income Tax (-$6.7 million, or -5.4%, below target), and Other sources, including the Estate Tax, Property Transfer Tax, and Bank Franchise Tax.
The underperformance in the Estate Tax was again tied to that source reaching its statutory maximum level of $28.875 million in receipts for the 2025 fiscal year in January, with further receipts being redirected to the Higher Education Trust Fund. For the fiscal year as a whole, General Fund receipts were $88.2 million, or 3.7%, above the consensus target of $2,362.3 million.
Revenues in the Transportation Fund missed the $31.9 million June consensus target by -$3.1 million, or -9.8%, yielding $28.8 million in total. This was driven by Motor Vehicle (MV) Purchase and Use (-$3.0 or 26.8% below) and MV Fees (-$0.4 million or 4.0% below). Full fiscal year receipts were -$7.4 million, or 2.3%, below their $320.9 million consensus cash flow target.
Monthly Education Fund revenues of $61.8 million were -$5.3 million, or -7.9%, lower than their June $67.0 million cash flow target. The majority of this miss can be attributed to underperformances in MV Purchase and Use (-$1.8 million or 31.3% below), Sales and Use (-$1.6 million or 3.3% below), and the Lottery Transfer (-$1.6 million or 25.7% below). Despite this underperformance, for the full fiscal year Education Fund receipts were $0.09 million, or 0.01%, above their $762.6 million consensus target.
According to Secretary Clark: “The General Fund ended the fiscal year in a strong position relative to consensus forecast targets. Education Fund revenues were almost exactly on target, and the Transportation Fund ended the year below target. Revised expectations for Fiscal Year 2026 revenues were presented to the Emergency Board on July 31st as part of the July consensus revenue forecast.”
Revenue Forecast Update July 31, 2025
Tom Kavet, Kavet & Rockler, Townshend, Vermont
To date, the U.S. economy has remained resilient in the face of mounting downside risks from policy chaos and tariff uncertainty, but this may not last. Implementation of the highest effective tariff rates in more than 90 years and a virtual cessation of immigration and expansive deportations will lead to slower economic growth and higher inflation in FY26 and FY27, making it harder for the Fed to shift back to a more neutral monetary policy. While the recently enacted Reconciliation Bill adds some short-term stimulus, it will also add nearly $4 trillion in debt over the next decade and will exacerbate both Federal debt servicing costs and economic inequality.
Amidst the din of constant U.S. policy drama, strength in two backward-looking revenue sources, Corporate and Personal income taxes, buoyed State revenues in FY25, which closed the year about 2.4% above target across all funds. Elevated asset prices will keep these (and related) tax sources slightly above prior January projections for FY26 and FY27, but risks abound. As tariff and other policies come into focus, these projections may need to be revisited.
Tom Kavet is the legislative economist. Together with administration economist Jeff Carr of Economic & Policy Resources of Williston, the Emergency Board (Governor and chairs of the four legislative money committees) sets the revenue targets for the next fiscal year, while adjusting current fiscal year expectations.
According to the state economists:
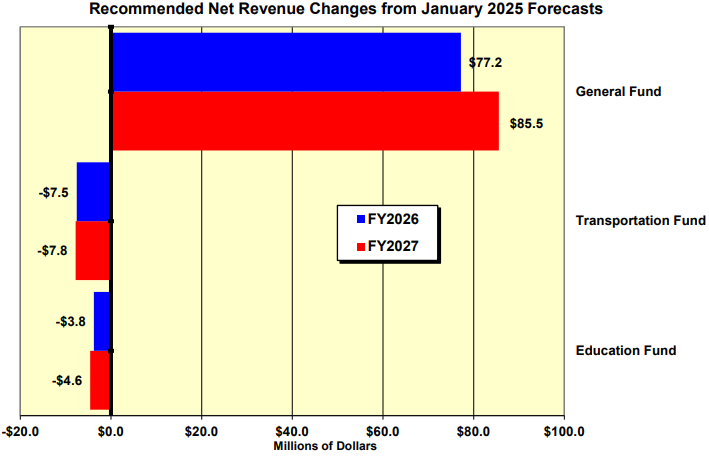
Their consensus revenue forecast indicates that the General Fund will grow by $77.2 million in FY26 (which began July 1, 2025) and grow by $85 million in FY27.
The Transportation and Education Funds, however, will retract. Transportation is expected to be -$7.5 million in FY26 and -$7.8 million in FY27. The Education Fund will be -$3.8 million in FY26 and -$4.6 million in FY27.
State Revenue Update
• Revenues in FY25 closed the year about 2.4% above target for all funds. Two large General Fund revenue sources, Personal and Corporate Income taxes, were responsible for most (about 90%) of the above target revenue, with both categories 5.1% above target.
• This revenue update represents relatively small changes to the prior January forecast, in the range of +1.4% to 2.0% of total revenue per year across all funds over the five-year horizon. Individual funds, however, will experience wider variation, generally ranging from minus 2.4% to plus 4.5% - with the exception of the Healthcare Fund in FY30, which will suffer from provisions in the recently enacted Reconciliation Bill, and face losses in the Hospital Provider Tax in FY30 that will cause it to exceed 10%.
Economic, Fiscal and Monetary Policy Update
• A plethora of Federal policy changes in the last 178 days has muddied the macroeconomic waters and made this forecast among the least certain since the pandemic days. Although the general direction was clear in January, the speed and degree to which some of the policy promises have been announced, attempted or enacted have generally added downside risk to this forecast update. The most significant policy areas affecting the U.S. and State economic outlook are: the imposition of large and constantly changing tariff rates; the recently passed H.R.1 Reconciliation Bill (Public Law: 119-21, aka OBBBA); immigration and deportation policy implementation; and ongoing attempts to withhold significant federal funds appropriated to the states.
• There has been a bewildering array of tariff announcements, extensions, temporary rates and exclusions since January 20th, affecting virtually every country with whom the U.S. trades. These announcements have been strategically vacuous, often capricious, and with conflicting and sometimes mutually exclusive stated objectives. Sometimes they claim they will reshore high-quality manufacturing jobs to the U.S. Sometimes they claim they will raise enough in customs duty revenues to eliminate the personal income tax. Sometimes they claim to be “reciprocal,” so as to make trade “fair.” Sometimes they aim to eliminate the balance of trade deficit in goods with each trading partner. And, sometimes their only objective is to force nations and leaders with whom the President has personal or political animosity to bend to his will.
• Although persistent tariffs at specific rates may accomplish some portion of their stated objectives, some of the time, they cannot accomplish all of the objectives nor can they accomplish most of them without serious short and longer-term negative consequences. They provide no rational basis upon which other countries can negotiate in good faith and create ill-will that could harm the U.S. in a multitude of ways in both the short and longer-term. The most effective trade negotiations usually employ both “carrots and sticks.” Tariffs are only sticks. While reshoring some U.S. manufacturing is desirable, this can take many years to accomplish and requires predictable long-term rates. These are not. In order to raise revenues anywhere close to those collected via the personal income tax (circa $2.4T per year), they would need to be so high as to choke off almost all trade. As of today, the tariffs announced and enacted would be expected to raise about $229B per year, less than 10% of the revenue raised by the personal income tax. Reciprocity in trade is desirable and fair, but to be fair, it must include all trade – both in goods and services. The announced “Liberation Day” reciprocity calculations excluded trade in services, in which the U.S. has run global trade surpluses for the last 54 years, and in an embarrassing display of mathematical and conceptual incompetence, published a formula that calculated “reciprocity” based on differences in the balance of trade in goods only. Tariffs can affect trade balances, but they cannot control them. In fact, there is no statistical correlation between tariff rates and balance of trade deficits. Trade deficits with China, for example, have persisted despite years of high tariffs.
• On “Liberation Day,” the tiny African country of Lesotho was awarded the highest standalone tariff of any country. Lesotho has a population about four times that of Vermont in an area that is about the same size as Vermont. It exported about $237M to the U.S. in 2024 (mostly textile and apparel products) and imported about $2.8M from the U.S., resulting in a trade deficit in goods of -$237.3M, which triggered a punishing 50% “reciprocal” tariff. The actual tariff Lesotho levies on U.S. products is controlled by the regional Southern African Customs Union and is about 7.5%. Per capita GDP in Vermont in 2024 was $72,725. In Lesotho, it was $945. No matter what the U.S. tariff rate is, there is no realistic way Lesotho could afford expensive U.S. imports to the tune of $237.3M per year. And if the U.S. does set a 50% tariff, it might divert production from Lesotho to some other low wage country who somehow wins a lower U.S. tariff, but it would be unlikely to ever be high enough to reshore these jobs to the U.S.. And if it did, what kind of jobs would these be? The U.S. Bureau of Labor Statistics reports a mean hourly wage in 2023 for “Cut and Sew Apparel Manufacturing” of $15.94 per hour – about $33,160 per year. Adjusted for inflation, this is still lower than the $17.01 per hour lowest Vermont Livable Wage (assuming two working adults, no children, in a rural location).
• The economic impacts from the tariffs announced through Sunday, July 27th, including the new 15% tariffs with the European Union and the very limited foreign retaliation to date, all in perpetuity, have been estimated and summarized by the Yale Budget Lab as follows: 1) An overall average effective tariff rate before substitution of 18.2%, the highest since 1934, and after consumption shifts, an average effective rate of 17.3%. 2) An initial price level impact of about 1.8% in 2025, which represents an average U.S. household income loss of $2,400 with a longer-term post-substitution price increase of 1.5% and a per household loss of $2,000 (in 2025 dollars). 3) Price impacts will be highest in clothing and textiles products, with short-run prices increasing 39% for leather products (shoes and hand bags), 37% for apparel, and 19% for textiles. After substitution and global supply shifts, in the long-run, prices for these product areas will still remain 18%, 17%, and 10% higher, respectively. Food prices will rise 3.4% in the short-run and stay 2.9% higher in the long-run. Fresh produce is initially 6.9% more expensive while stabilizing at 3.6% higher. Motor vehicle prices will rise 12.3% in the short-run and 9.5% in the long-run, the equivalent of an additional $5,900 and $4,600 respectively to the price of an average 2024 new car. 4) Real U.S. GDP losses in 2025 and 2026 of about -0.5 percentage points each year from all 2025 tariffs. In the long-run, the U.S. economy will be persistently 0.38% points smaller, the equivalent of $115 billion annually in 2024 dollars. Notably, the long-term real GDP hit to China from the tariffs, at -0.22%, will be smaller than that to the U.S. 5) Although tariffs shrink the overall size of the US economy in the long-run by 0.38% per year, beneath aggregate GDP they also drive a reallocation across US sectors. Long-run output in the manufacturing sector will expand by 2.0% under the tariffs, with nonadvanced durable manufacturing output 3.8% larger and nondurable manufacturing 1.1% larger. However, advanced manufacturing will be 2.8% smaller. Moreover, the expansion of the overall manufacturing sector will more than crowd out the rest of the economy, with construction shrinking by 3.5%, agriculture by 0.9%, and mining and extraction by 1.3%. 6) The unemployment rate in the U.S. will be 0.4 percentage points higher by the end of 2025 and 0.7 percentage points higher by the end of 2026. Payroll employment will be 494,000 lower by the end of 2025. 6) The tariffs are expected to raise about $229 billion per year between 2026 and 2035 after substitution and output effects are included, about $2.3 trillion over the ten-year period. 7) Tariffs are a regressive tax, especially in the short-run. This means that tariffs burden households at the bottom of the income distribution more than those at the top as a share of income. This regressivity is evident in the current tariff levels, with the short-run burden on the poorest decile, who will suffer a 3.4% income loss, being more than 3x that of the highest decile, who will suffer a 1.0% AGI loss. The average annual cost to households in the bottom decile will be $1,300 and in the highest decile, $4,900, with a median annual cost of $2,200 per household in 2025 dollars.
• When the “Liberation Day” tariffs were first announced in early April, global markets immediately tanked and were soon followed by a simultaneous collapse in all U.S. assets including equities, the dollar and the bond market. This catastrophe prompted an immediate 90 day pause in the tariffs, scheduled to end on July 8th, but this date was later extended to August 1st. In the interim, many exemptions, temporary tariffs and even a few “deals” have been struck, almost all at rates well below the so-called “reciprocal” tariff rates. Believing that most of the tariff deals would ultimately involve much lower rates along with various carve-outs, delays, exclusions and possibly even be short-lived, U.S. equity markets have since rebounded to record highs. Meanwhile, most trade deals seem to be settling in the 15% range for U.S. tariffs vs. prior 2024 rates of 0%-5%.
• Notably, most countries have avoided retaliatory tariffs and have accepted the higher U.S. tariffs, knowing that they could be rescinded by pending legal challenges and/or a changed Congress or Presidency in 2 or 4 years. They also know that the current President could change his mind at any time and raise or lower tariffs at will. They also know that most retaliatory tariffs would hurt their countries more than they would hurt the U.S. – as Canada’s retaliatory tariffs to date show. These will all weigh against meaningful immediate investments in re-shoring by either American or foreign firms. In the meantime, U.S. firms not wishing to attract the ire of the President or lose market share will try to swallow the tariff costs through lower margins – which is currently happening for about 60% of the tariff costs in the three months ending in June - but ultimately, those firms who can pass on price increases will, and the U.S. consumer will ultimately bear most of the tariff costs.
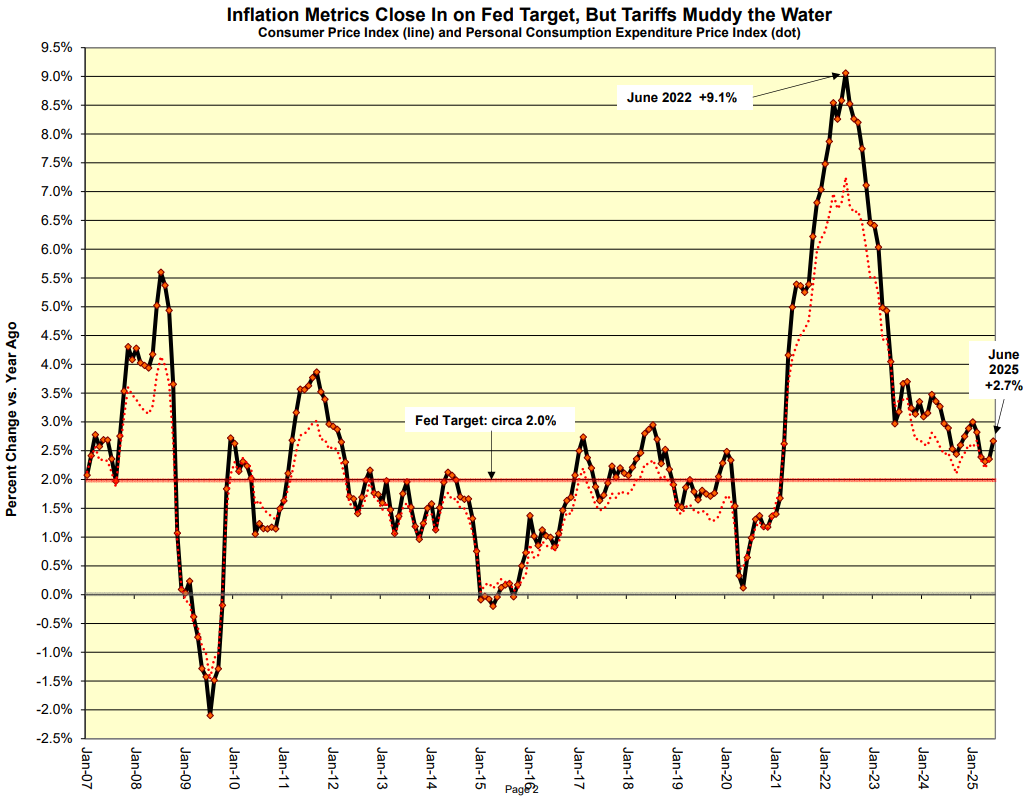
• Because the current tariffs greatly exceed anything experienced in recent history, there is uncertainty regarding the precise timing and magnitude of the macroeconomic impacts, including effects on inflation and, importantly, inflation expectations. As a result, the Fed has paused planned interest rate cuts until there is greater clarity on what the tariff levels will be and how the economy will respond to these and other policy actions. We still expect the Fed to make two quarter point cuts in the second half of 2025 and further cuts in 2026, pending data on both inflation and labor markets.
• On a less negative note, the recently enacted Reconciliation Bill, will provide some near-term stimulus through personal income gains and higher corporate profits and investment. Although the legislation is highly regressive, there are near-term net income gains across all income classes. When the Medicare cuts begin after the midterm elections, however, there will be net income losses for many, with the CBO estimating that those in the lowest decile will lose an average of $1,600 per year due to benefit cuts and those in the highest decile will reap an additional $12,000 per year in income from the tax cuts. To the extent the legislation streamlines and removes unnecessary regulatory burdens and accelerates depreciation, it will improve productivity, R&D spending, and corporate profitability.
• Other Federal actions and policies negatively affecting the economy, both near-term and longer-term, include performatively violent deportations, raids on places of work, removing persons legally in the U.S. for spurious reasons, defunding some of the nation’s top tier research programs at universities, upending judiciary processes by politicizing the Department of Justice, ignoring judicial rulings, blackmailing law firms into political submission, threatening the independence of the Federal Reserve Board, withholding appropriated Federal funds from states based on vague personal or political rationales, reducing international student enrollments in higher education, and deterring international travel to the U.S.. Both tourism and higher education, of course, are major exporting sectors in the U.S. and Vermont economies. While some of these actions may not have obvious or immediate economic effects, job markets in some sectors and parts of the country are already reeling from the loss of immigrant labor.
• A year ago, the foreign- born labor force was growing at a 5% annual rate. In recent months, it has been declining. As a result, growth in the overall labor force has been close to stalling out, leaving little room for output growth. Some sectors are particularly hard hit by the loss of immigrant labor. About 30% of all U.S. construction workers are immigrants, and about half of these are undocumented. In some states, such as CA, TX, FL, NY, NJ and MD, the share of immigrant construction workers is as high as 40%. In some construction trades (like drywall, roofing, painting, plastering, flooring, etc.), the share approaches or exceeds 50%. Immigrants also represent 18% of all healthcare workers, including 27% of physicians and surgeons, 16% of registered nurses, and 23% of healthcare support staff. The Reconciliation Bill gives ICE an additional $30 billion to accelerate arrests and deportations, $45 billion to build new detention facilities, $47 billion for border wall building, $14 billion to states to help with arrests and deportations, and $10 billion for other border enforcement actions. This will surely further dent labor force growth, economic output, tax payments and secondary spending from the immigrant labor force. It will also raise prices in sectors dependent upon these workers. Despite all the hand-wringing and money to fund sealing off the borders and evict those who have legally and illegally entered the U.S., the core problem is that Congress has been unable to enact any meaningful legislation that both controls the borders and provides reasonable and expeditious paths for prescribed legal immigration and/or temporary work provisions.
The arbitrary and vindictive withholding of Federal funds from states, as highlighted in the recent (and ongoing) case of Maine, represents a meaningful budgetary and economic risk to any state government during this Administration, especially those not fully supporting the President and his policies. After incurring a minor slight over a policy difference with Maine Governor, Janet Mills, at a National Governors Association meeting, the President launched a series of harassing investigations and punishing economic actions by withholding appropriated funding from multiple Federal agencies to the State of Maine and the University of Maine. While the State has successfully fought back in the courts, the delays and funding gaps have disrupted planning, staffing and program operations in critical research and educational programs that may yet result in lasting economic impacts.
• Recession risks, as measured by a Wall Street Journal poll of 75 economists, spiked from 22% in January to 45% in April following the “reciprocal” tariff announcements, but have receded since then to 33% in July. Like the stock market, most economists now assume (or at least hope) the final tariff agreements will be blunted by work-arounds, exclusions and other provisions that significantly lower the effective announced rates. To date, this remains uncertain, although, in the case of China, this appears increasingly likely.
• Labor markets in Vermont and the U.S. have shown signs of softening, as unemployment rates tick up, quit rates drop and the gap between the number of unemployed persons and the number of job openings shrinks. Still, yearover-year nonagricultural employment levels have increased in both the U.S. and Vermont for more than 50 consecutive months (with one anomalous exception in VT), although slowing considerably of late. At 2.6% in June, Vermont still boasts the nation’s third lowest unemployment rate and has been the lowest in New England for the past 40 months.
• Home price growth rates continued to rise through the first quarter of 2025, with every state in the nation showing year-over-year growth for the 5th consecutive quarter. New England states continued to have higher than average price growth, with Connecticut and Rhode Island tied for the highest in the nation, at 8.4%, and all six NE states among the top 23 states. In the last four years, Vermont home prices have risen 55.8%, tied with Rhode Island for the fourth highest in the nation, after NC, SC and, in first place, Maine at 57.8%. During this period, home prices in all New England states grew by more than 50% except Massachusetts, where they rose 42.8%. With sellers frozen in place with low existing mortgages, the market has lacked inventory, causing prices to be driven higher. With some Fed easing in the next 18 months, the inventory of homes for sale should grow and prices will flatten and even decline in many markets. Home price growth has exceeded income growth to such an extent that home prices may be level or slightly declining for an extended period.
• It is important to once again note that in addition to the new federal fiscal stimulus in the Reconciliation Bill, there is still a huge pipeline of unspent federal funds parked in state bank accounts and not yet spent that will be powering economic activity in Vermont and throughout the nation – assuming it is not clawed back before it can be spent for its intended purposes. Vermont’s average FY26 unrestricted cash balance is expected to be about $1.5B, down from a peak balance of $2.2B in FY23, and which would be loosely consistent with a total U.S. state cash reserve of more than $700B. As this is spent down – and much of it is required to be spent or dedicated by FY26 – it will act as a significant economic stimulus and offset to the Fed’s efforts to slow the economy and bring inflation down to its target rate.
• As of this writing, there is still considerable uncertainty regarding final trade agreement details, despite the announced August 1 deadline. We are assuming case-by-case flexibility that will mitigate some of the harm, but trade deals are complicated and usually take time to fully specify and implement. So, too, do the global tariff workarounds – and there will be many. This implies fairly long lags between announced agreements and actual economic impacts. As such, we may need to revisit these forecasts if negative impacts are not quickly mitigated, in whole or part. In addition to tariffs, there are many other downside risks scoped out in the Moody’s Risk Matrix.
To support vital journalism, access our archives and get unique features like our award-winning profiles, Book of Lists & Business-to-Business Directory, subscribe HERE!
