by Timothy McQuiston, Vermont Business Magazine Today, the Vermont Department of Labor reported today that the February 2024 seasonally adjusted statewide unemployment rate for February was 2.3 percent. This reflects no change from January's revised estimate. Vermont has the third lowest rate in the nation, behind North (2.0%) and South (2.1%) Dakota. California (5.3%) has the highest rate.
The comparable United States rate in February was 3.9 percent, an increase of two-tenths of one percentage point from the revised January estimate.
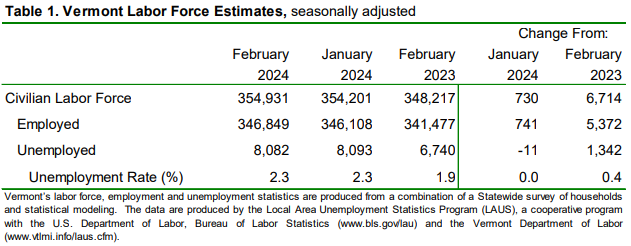
The civilian labor force participation rate was 65.3 percent in February, an increase of two-tenths of one percentage point from the prior month’s revised estimate.
See Data Tables Below
Labor Commissioner Michael Harrington said: “February’s data marks the 40th consecutive month of growth in the labor force, with current estimates showing that Vermont's labor force has reached its highest level since 2018. This increase is not limited to a specific cohort; instead, it reflects a widespread rise across many different demographic populations. However, even with this news, skilled workers remain in high demand across the state, with many employers citing Vermont’s workforce shortage as the number one challenge they face.
"If you, or someone you know, is interested in a career in the trades or other specialized field, Vermont’s Registered Apprenticeship Program offers an opportunity for individuals to ‘earn while they learn.’ The Department of Labor has recently partnered with the Vermont Manufacturing Extension Center to expand Registered Apprenticeship opportunities within the manufacturing sector. For more information, please visit www.labor.vermont.gov/apprenticeship.”
The seasonally adjusted Vermont data for February show a modest improvement from January. The Vermont civilian labor force increased by 730 from the prior month’s revised estimate (see Table 1). The number of employed persons increased by 741 and the number of unemployed persons decreased by 11. No changes were statistically significant in the seasonally adjusted series.
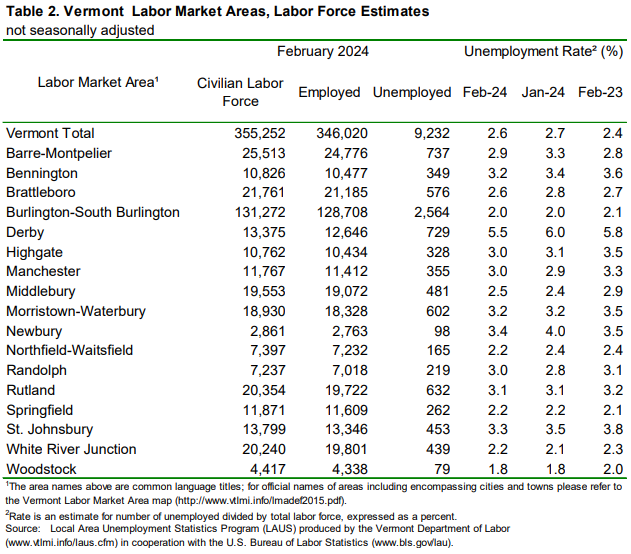
The February unemployment rates for Vermont’s 17 labor market areas ranged from 1.8 percent in Woodstock to 5.5 percent in Derby (note: local labor market area unemployment rates are not seasonally-adjusted – see Table 2). For comparison, the February unadjusted unemployment rate for Vermont was 2.6 percent, a decrease of one-tenth of one percentage point from the revised unadjusted January level and an increase of two-tenths of one percentage point from a year ago.
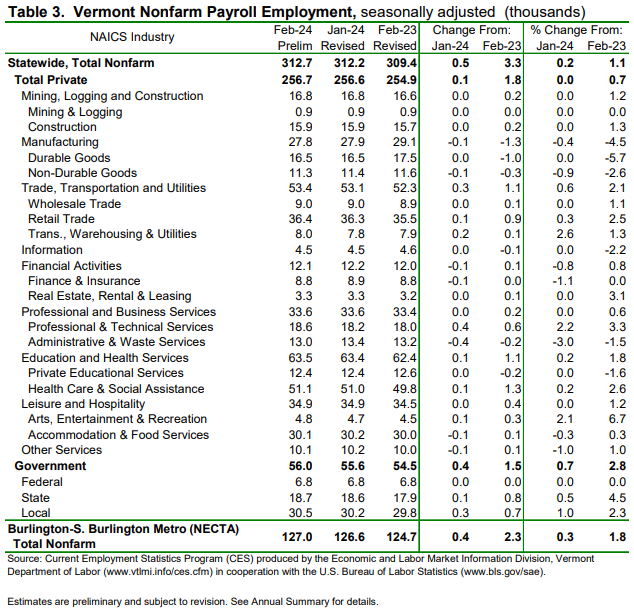
Seasonally Adjusted (Table 3)
The seasonally adjusted data for February reported an increase of 500 jobs from the revised January data. There was an increase of 600 jobs between the preliminary and the revised January estimates due to the inclusion of more data. The seasonally adjusted over-the-month changes in February varied at the industry level. Industries with a notable increase included: Transportation, Warehousing, & Utilities (+200 jobs or +2.6%), and Professional & Technical Services (+400 jobs or +2.2%). The industry with a notable decrease was Administrative & Waste Services (-400 jobs or -3.0%).
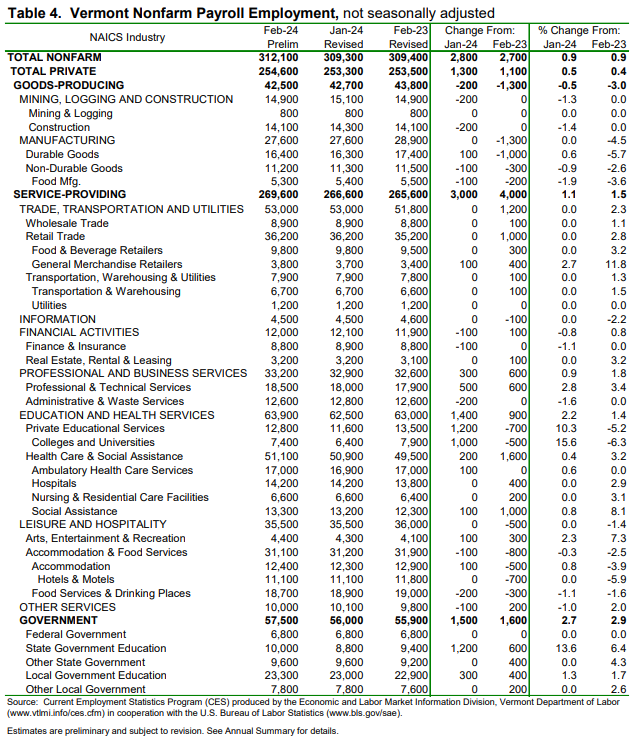
Not-Seasonally-Adjusted (Table 4)
The preliminary ‘not-seasonally-adjusted’ jobs estimates for February showed an increase of 2,800 jobs when compared to the revised January numbers. As with the seasonally adjusted data, this over-the-month change is from the revised January numbers which experienced an increase of 1,100 jobs from the preliminary estimates. The broader economic picture can be seen by focusing on the over-the-year changes in this data series. As detailed in the preliminary not seasonally adjusted February data, Total Private industries increased by 1,100 jobs (+0.4%) over the year and Government (including public education) employment increased by 1,600 jobs (+2.9%) in the past year.
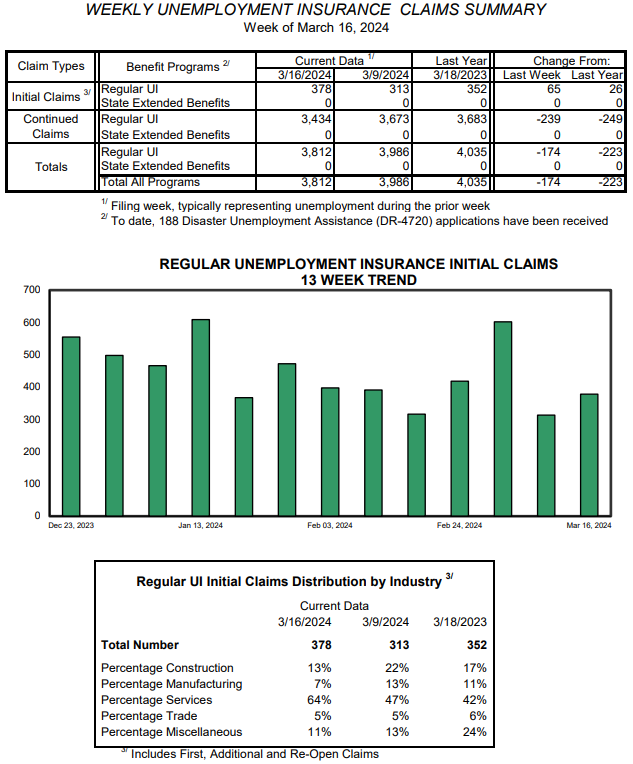
Weekly UI Claims
Meanwhile, weekly unemployment claims increased slightly in Vermont while falling slightly nationally. The FED chose not to cut or increase interest rates largely based on the continuing strength of the overall economy. Labor remains strong and home sales increased nationally. Inflation rates are holding steady at a lower level than last year but not as low as regulators would want in order to cut rates.
In Vermont, weekly claims as of March 16 were 378, up 65 from the previous week and up 26 from last year. Claims this time of year typically hold at a relatively low level after the volatility of the holiday season.
The US DOL reported that for the week ending March 16, the advance figure for seasonally adjusted initial claims was 210,000, a decrease of 2,000 from the previous week's revised level. The previous week's level was revised up by 3,000 from 209,000 to 212,000. The 4-week moving average was 211,250, an increase of 2,500 from the previous week's revised average. The previous week's average was revised up by 750 from 208,000 to 208,750.
| State | February 2024(P) rate |
Rank |
|---|---|---|
|
North Dakota |
2.0 | 1 |
|
South Dakota |
2.1 | 2 |
|
Vermont |
2.3 | 3 |
|
Maryland |
2.4 | 4 |
|
Nebraska |
2.5 | 5 |
|
New Hampshire |
2.6 | 6 |
|
Kansas |
2.7 | 7 |
|
Minnesota |
2.7 | 7 |
|
Utah |
2.8 | 9 |
|
Wyoming |
2.8 | 9 |
|
Iowa |
2.9 | 11 |
|
Massachusetts |
2.9 | 11 |
|
Alabama |
3.0 | 13 |
|
Virginia |
3.0 | 13 |
|
Wisconsin |
3.0 | 13 |
|
Florida |
3.1 | 16 |
|
Georgia |
3.1 | 16 |
|
Hawaii |
3.1 | 16 |
|
Mississippi |
3.1 | 16 |
|
South Carolina |
3.1 | 16 |
|
Idaho |
3.3 | 21 |
|
Missouri |
3.3 | 21 |
|
Tennessee |
3.3 | 21 |
|
Maine |
3.4 | 24 |
|
Montana |
3.4 | 24 |
|
Pennsylvania |
3.4 | 24 |
|
Colorado |
3.5 | 27 |
|
Indiana |
3.5 | 27 |
|
North Carolina |
3.5 | 27 |
|
Arkansas |
3.6 | 30 |
|
Oklahoma |
3.6 | 30 |
|
Ohio |
3.7 | 32 |
|
Michigan |
3.9 | 33 |
|
New Mexico |
3.9 | 33 |
|
Rhode Island |
3.9 | 33 |
|
Texas |
3.9 | 33 |
|
Delaware |
4.0 | 37 |
|
Arizona |
4.1 | 38 |
|
Louisiana |
4.2 | 39 |
|
Oregon |
4.2 | 39 |
|
West Virginia |
4.3 | 41 |
|
Kentucky |
4.4 | 42 |
|
New York |
4.4 | 42 |
|
Connecticut |
4.5 | 44 |
|
Alaska |
4.7 | 45 |
|
Washington |
4.7 | 45 |
|
Illinois |
4.8 | 47 |
|
New Jersey |
4.8 | 47 |
|
District of Columbia |
5.1 | 49 |
|
Nevada |
5.2 | 50 |
|
California |
5.3 | 51 |
|
Footnotes |
||
|
Note: Rates shown are a percentage of the labor force. Data refer to place of residence. Estimates for the current month are subject to revision the following month. |
||
Last Modified Date: March 22, 2024
The Unemployment and Jobs Report for March is scheduled to be released on Friday, April 19, 2024 at 10:00 a.m.
Source: Vermont DOL 3.22.2024.
